Methods
Subspace Exploration
In high-dimensional data, a part of the dimensions is called a subspace, while a part of the data items is called a subset. Patterns like data structures or dimension relationships will change in different subspaces / subsets. But such changes can't be observed when analyzing the whole dataset. It is necessary to dive into various subspaces to disclose hidden data patterns. In our lab, much studies have been done, aiming to help users explore and gain insights into subspaces at different levels.
Interactively Generating Visualizations
Visualization is of great use for data analysis. But creating a visualization often requires programming techniques, which are not guaranteed in the general public. It impedes not only the analytic process, but the application of state-of-the-art visualization methods. Targeting the problem, we have designed online visual analytic tools, where users can interactively create their desired visualizations, for not only high-dimensional, but generally any kind of data at hand. Our tools are open to general users, and have been well received.
Parallel Coordinates
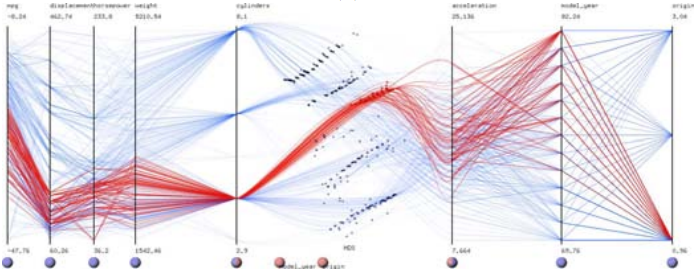
Parallel coordinates is a popular technique for high-dimensional data visualization. Axes of multiple dimensions are aligned in parallel, with polylines going through them to indicate the data values. Such design is featured by its compactness and effectiveness in conveying high-dimensional information. However, it also suffers a lot from visual clutter, as well as the inconvenient interactions. Regarding these problems, we have done much studies to improve parallel coordinates from various aspects.
Applications
Spatial Temporal Data
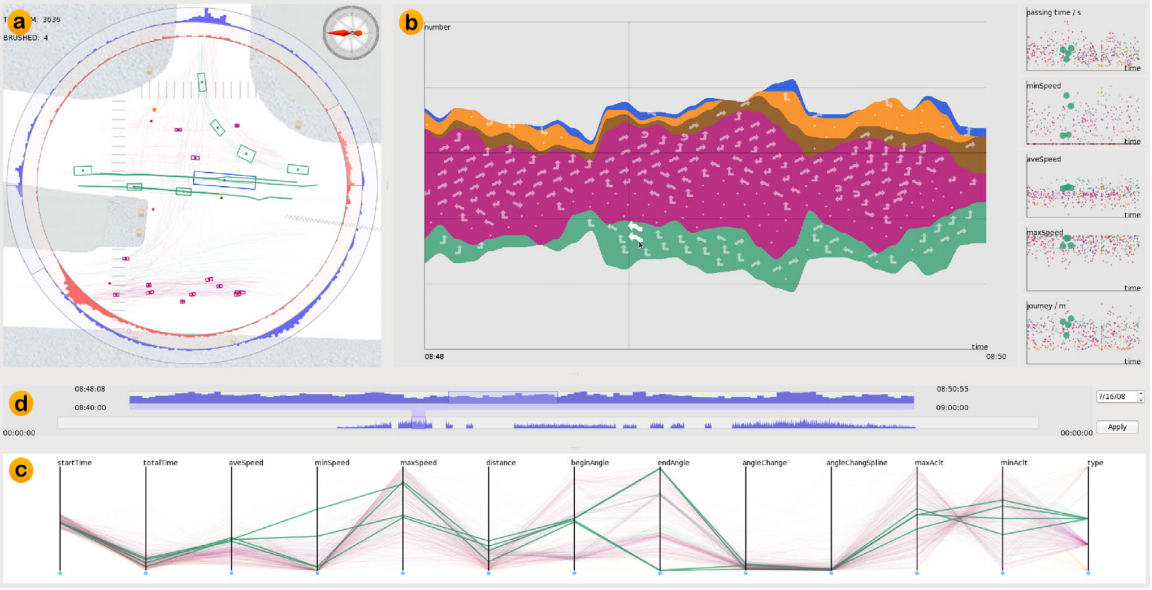
With the development of positioning techniques, spatial-temporal data is becoming more and more common in our daily lives. Movements are recorded and analyzed for people, vehicles and even the globe, to gain insights into their behavior patterns. Despite the spatial-temporal side, multiple attributes often come along in such data. They describe properties of the moving objects, providing extra information for understanding the spatial-temporal records. We apply high-dimensional visualization techniques to display the attributes in spatial temporal data.
Scientific Data
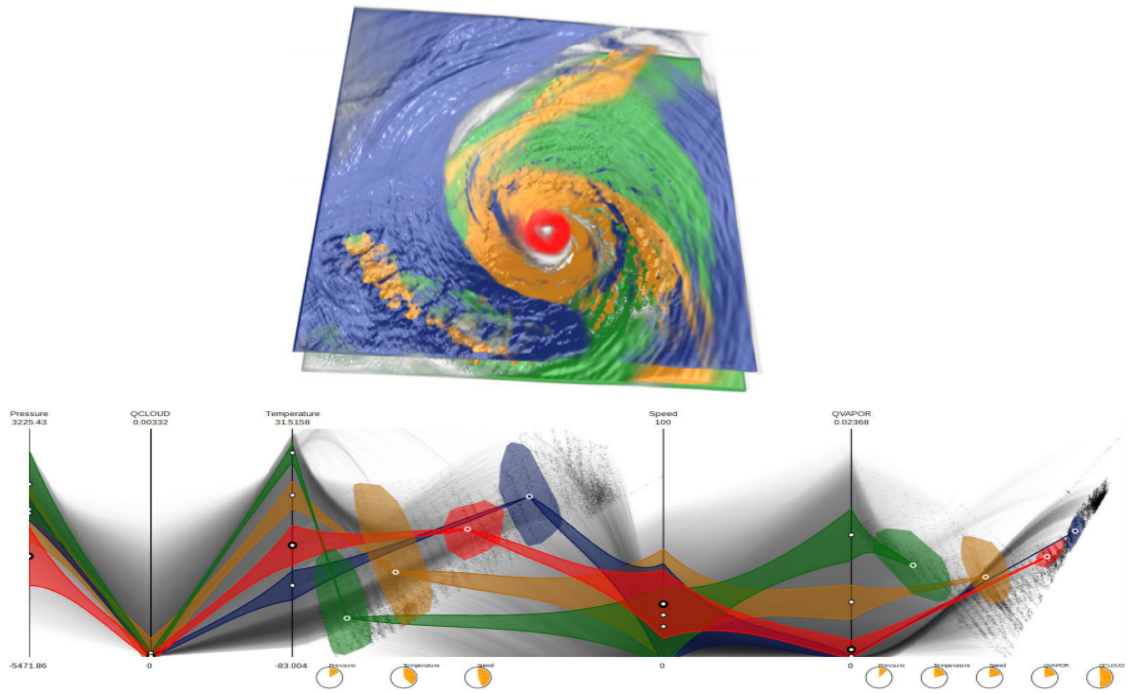
When doing experiments, scientists collect information from all kinds of aspects, in order to analyze and explain the observed phenomena. As a result, large amounts of high-dimensional data are produced. Visualization provides an efficient way for mining the many variables, thus accelerating the knowledge discovering process. In our lab, we help domain scientists process and analyze their experiment data, where high-dimensional visualization techniques play an important role.


