Introduction
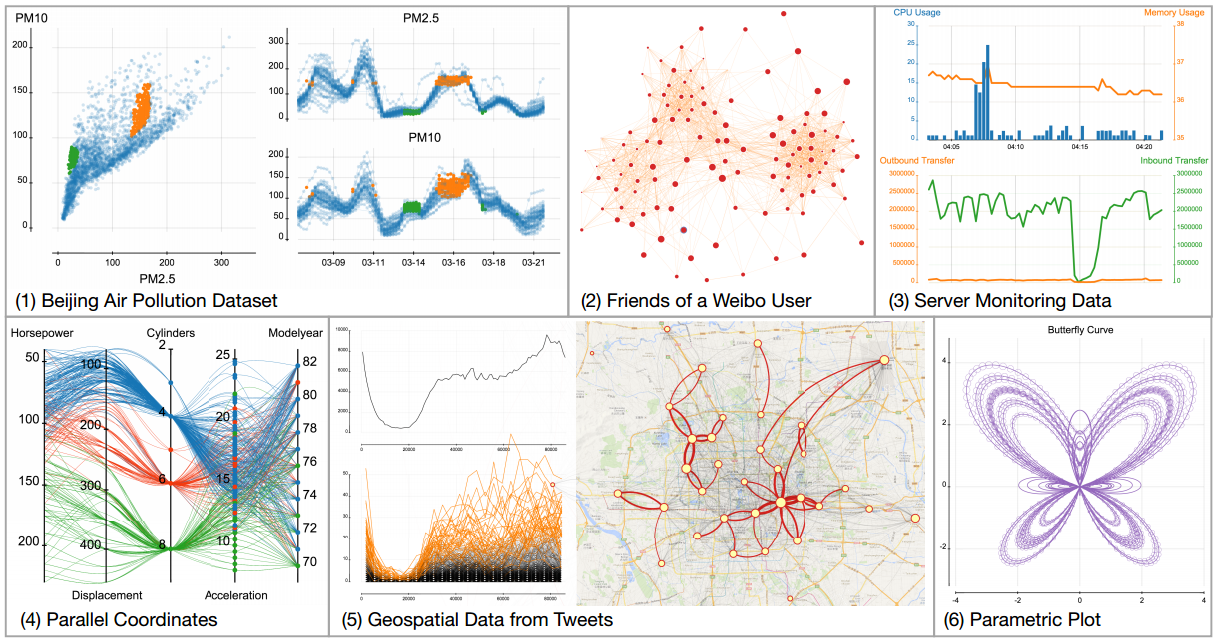
Visualization is of great use for data analysis. But creating a visualization often requires programming techniques, which are not guaranteed in the general public. It impedes not only the analytic process, but the application of state-of-the-art visualization methods. Targeting the problem, we have designed online visual analytic tools, where users can interactively create their desired visualizations, for not only high-dimensional, but generally any kind of data at hand.
Our first try is the Visualization Assembly Line [1]. This is an online tool where users can customize visualizations for high-dimensional data. You can try on the tool HERE.

With the given data, users can freely draw and place axes for different dimensions. Then they can link the multiple axes with polylines, curves or scattered points, so as to create visualizations like parallel coordinates, scatterplot matrix, dimension reduced projection, etc. Interactions like brushing, zooming and panning are also enabled with the created visualizations. After works are done, users can upload their visualizations to the online gallery, sharing and communicating with the other users.
In fact, not only high-dimensional data, but generally any kind of data could be processed using customized visualizations. We extend the framework of Visualization Assembly Line, and propose the iVisDesigner, an online tool for customizing general types of visualizations. You can try on the tool HERE

Citation
- Donghao Ren, He Xiao and Xiaoru Yuan. Visualization Assembly Line: Sketch-Based Multidimensional Data Visualization Construction and Online Collaboration. IEEE Pacific Visualization Symposium 2013 (PacificVis Poster 2013), - Best Poster Award Sydney, NSW, Australia, Feb. 26-Mar. 1, 2013.
- Donghao Ren, Tobias Hollerer, Xiaoru Yuan. iVisDesigner: Expressive Interactive Design of Information Visualizations. IEEE Transactions on Visualization and Computer Graphics (InfoVis'14), 20(12):2092-2101, 2014.
| Paper: pdf (14.7 MB) |