Description
Parallel coordinates is a popular technique for high-dimensional data visualization. Axes of multiple dimensions are aligned in parallel, with polylines going through them to indicate the data values. Such design is featured by its compactness and effectiveness in conveying high-dimensional information. However, it also suffers a lot from visual clutter, as well as the inconvenient interactions. Regarding these problems, we have done much studies to improve parallel coordinates from various aspects.
Revealing Data Clusters
One problem with parallel coordinates, is the visual clutter caused by large amounts of polylines. Users can't perceive any trends or structures, without effective methods to outline patterns in the data. Among the many data patterns, cluster is often the most concerned one. We have proposed several techniques in the last few years, to eliminate visual clutter and help users find clusters in parallel coordinates.
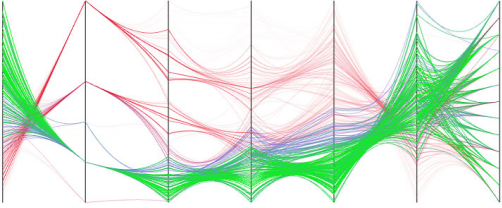
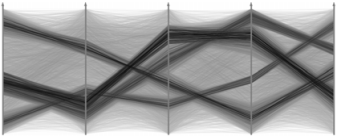
One solution is to let clusters show themselves. We can introduce attractions into polylines [8], allowing them to bend and automatically gather based on in-between forces. The lines will be bundled as a result, indicating the underlying data clusters (shown below left). With a spatting strategy, we can also update the opacity of each line based on its influences on the the other data [7]. The more neighbors it has, the more important it is, and thus the more opaque it would be. The resulting image clearly shows local clusters with high data density (shown below right).


Apart from the automatic algorithms, it's also important to involve users in the clustering process. We have proposed an interactive clustering method [5], allowing users to drag and drop the so-called operators, to gather or push away the cluttered lines. In this way, users can define visual clusters in parallel coordinates, according to their own perception.

Integrating with Scatterplots
Another problem in parallel coordinates, is the non-intuitive data encoding, with the inconvenient interactions on polylines. In contrast, scatterplots are very common and intuitive. Interactions like brushing are also natural with scattered points. That inspires us to integrate the two techniques, so as to improve both of them.


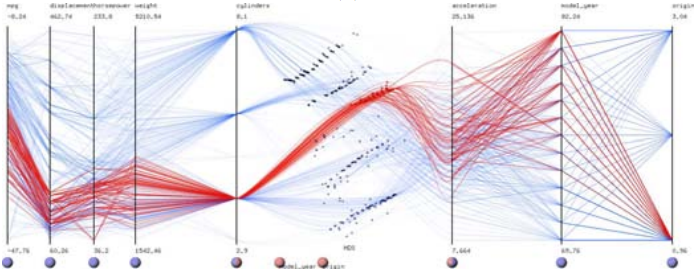
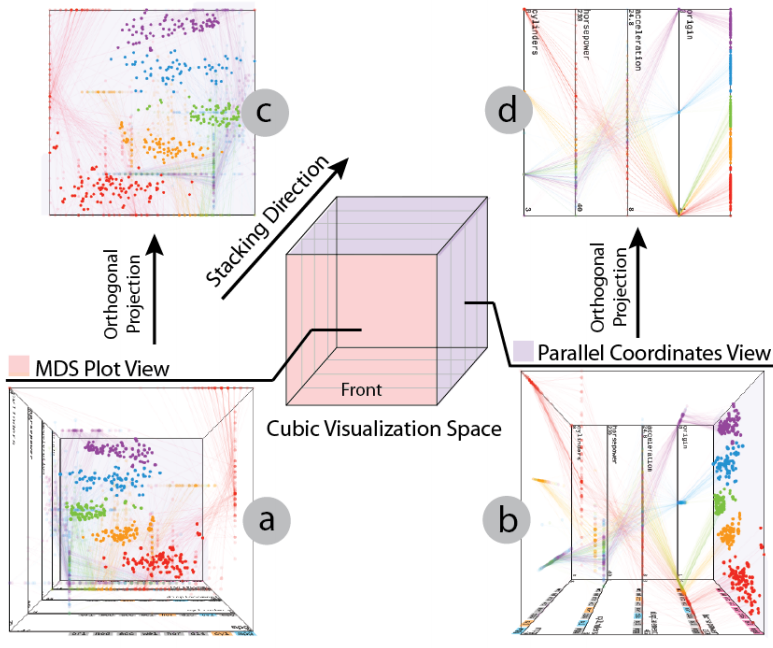
The integration could be a 2D one [6], where the scatterplot is embedded in the interval between axes in parallel coordinates (shown above right). The scatterplots can not only show bi-variate, but high-dimensional distributions with dimension-reduce projections. Polylines are bent into curves going through their corresponding points. We can also make a 3D cube [2], where the two views are orthogonal to each other ((c), (d) in the image above right). Polylines are linked to scattered points on one side of the cube ((b) in the image above right). With the two techniques combined together, we can now better interpret and interact with data in parallel coordinates, without losing its benefits like scalability and compactness.
Transfer Function Design in Scientific Data
Multiple attributes often come along with scientific data. For example, data of a hurricane could include measurements like vapor content, pressure, temperature, etc. When visualizing the data, it's necessary to convey these features by handing the transfer function, a mapping from attribute values to colors and opacity. Regarding that, we have proposed a multivariate transfer function design using scatterplot embedded parallel coordinates [1, 3, 4]. Users can brush in the high-dimensional view and see the featured regions in the spatial distribution (shown in the below image). They can also brush in the spatial view, in order to see the features of the selected data.

More Applications
Apart from the above researches, we widely use parallel coordinates in different application fields, such as trajectory analysis, carbon footprint studies, pollution researches, etc. Our improved parallel coordinates are proved effective in helping analysts work on multivariate data. We'll leave the details to other chapters concerning applications.
Citation
- Hanqi Guo, and Xiaoru Yuan. Design and Application of PKU Scientific Visualization System. In Proceedings of National Annual Conference on High Performance Computing (HPC China 2013), pages 551-558, Guilin, China, Oct. 27 - Oct. 31, 2013. (in Chinese).
| Paper: pdf (1.3 MB) | - Bowen Yu, Richen Liu and Xiaoru Yuan. MLMD: Multi-Layered Visualization for Multi-Dimensional Data. In Proceedings of Eurographics 2013 Short Papers, Leipzig, Germany, June 17 - June 21, 2013.
| Paper: pdf (4.81 MB) | Video: mp4 (9.35 MB) | - Hanqi Guo, He Xiao, and Xiaoru Yuan. Scalable Multivariate Volume Visualization and Analysis based on Dimension Projection and Parallel Coordinates. IEEE Transactions on Visualization and Computer Graphics, 18(9):1397-1410, 2012.
| Paper: pdf (860 KB ) | - Hanqi Guo, He Xiao, and Xiaoru Yuan. Multi-Dimensional Transfer Function Design based on Flexible Dimension Projection Embedded in Parallel Coordinates. In proceedings of IEEE Pacific Visualization Symposium (PacificVis 2011), pages 19-26, Hong Kong, March. 1-4, 2011.
| Paper: pdf (1.13 MB) | Video: mp4 (4.93 MB) | - Peihong Guo, He Xiao, Zuchao Wang and Xiaoru Yuan. Interactive Local Clustering Operations In Parallel Coordinates. In proceedings of IEEE Pacific Visualization Symposium (PacificVis 2010), March. 2-5, 2010.
| Paper: pdf (0.52 MB) | Video: mp4 (35.7 MB) | - Xiaoru Yuan, Peihong Guo, He Xiao, Hong Zhou, and Huamin Qu. Scattering Points in Parallel Coordinates. IEEE Transactions on Visualization and Computer Graphics (InfoVis'09),, 15(6):1001-1008, 2009. (Cover Image)
| Paper: pdf (0.79 MB) | Video: mp4 (39.9 MB) | - Hong Zhou, Weiwei Cui, Huamin Qu, Yingcai Wu, Xiaoru Yuan, and Wei Zhuo. Splatting the Lines in Parallel Coordinates. Computer Graphics Forum (EuroVis'09), 28(3):759-766, 2009.
| Paper: pdf (1.82 MB) | - Hong Zhou, Xiaoru Yuan, Huamin Qu, Cui Weiwei, and Baoquan Chen. Visual Clustering in Parallel Coordinates. Computer Graphics Forum (EuroVis'08), 27(3):1047-1054, 2008.
| Paper: pdf (2.56 MB) |