Introduction
In high-dimensional data, a part of the dimensions is called a subspace, while a part of the data items is called a subset. Patterns like data structures or dimension relationships will change in different subspaces / subsets. But such changes can't be observed when analyzing the whole dataset. It is necessary to dive into various subspaces to disclose hidden data patterns. In our lab, much studies have been done, aiming to help users explore and gain insights into subspaces at different levels.
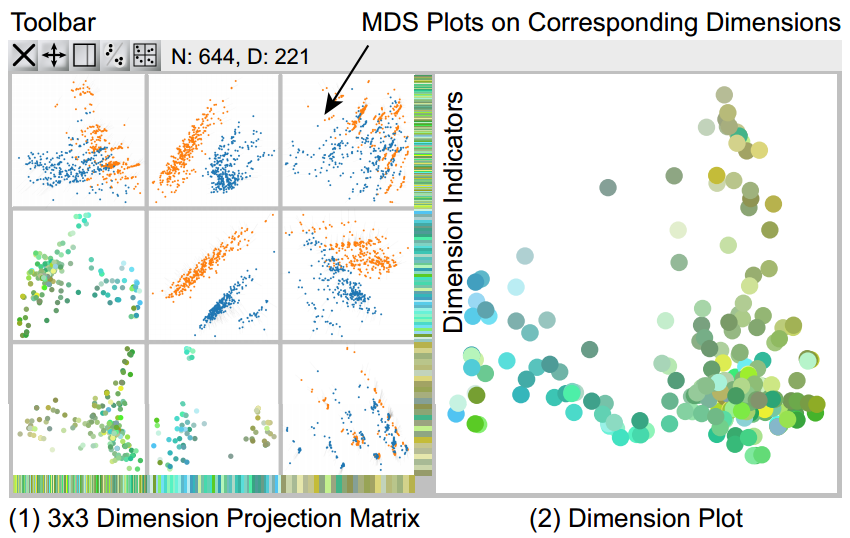
Subspaces have a hierarchical structure. A subspace can be divided into multiple smaller ones and so on. Besides, it's necessary to compare distributions in different subspaces in order to assess them. We propose the Dimension Projection Matrix / Tree [1], aiming to help users organize their explorations in the complex subspaces.


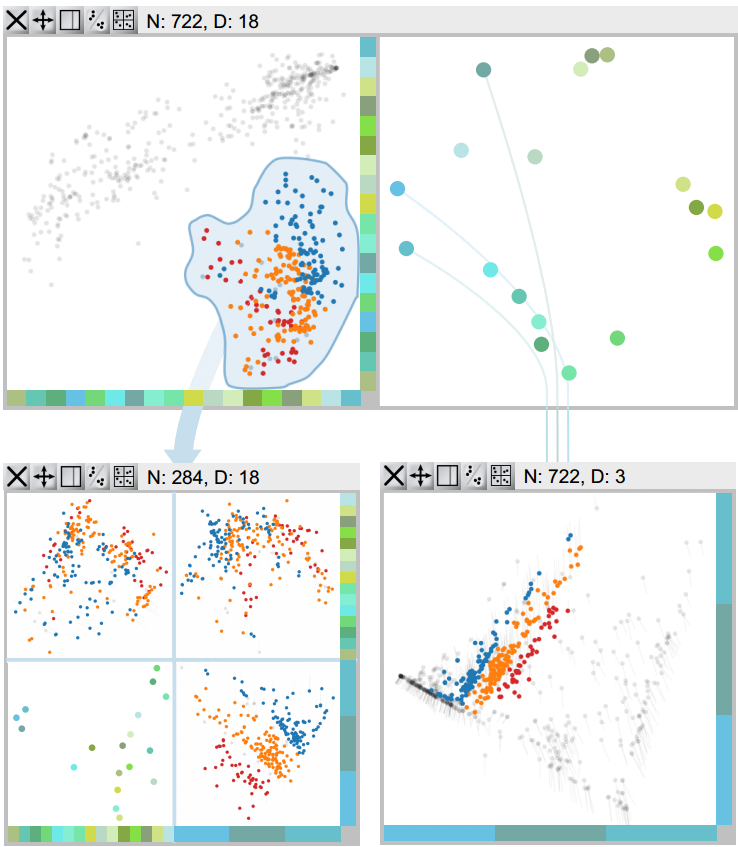
There are two concepts, namely the matrix and the tree. In the matrix, each row or column represents a small group of dimensions, while each cell is a union subspace of its row and column dimensions. Data or dimension projections are displayed in the cells, allowing users to link and compare them (shown above left). The tree on the other hand, is provided to organize the hierarchical explorations. Each node in the tree denotes a subspace. If the subspace is further divided into smaller ones, the node will split into multiple child nodes. Users can create a child node, by interactively choosing a part of the dimensions / data items (shown above right). With our method, users can not only travel deep into subspace details, but compare different subspaces and search for valuable data patterns.
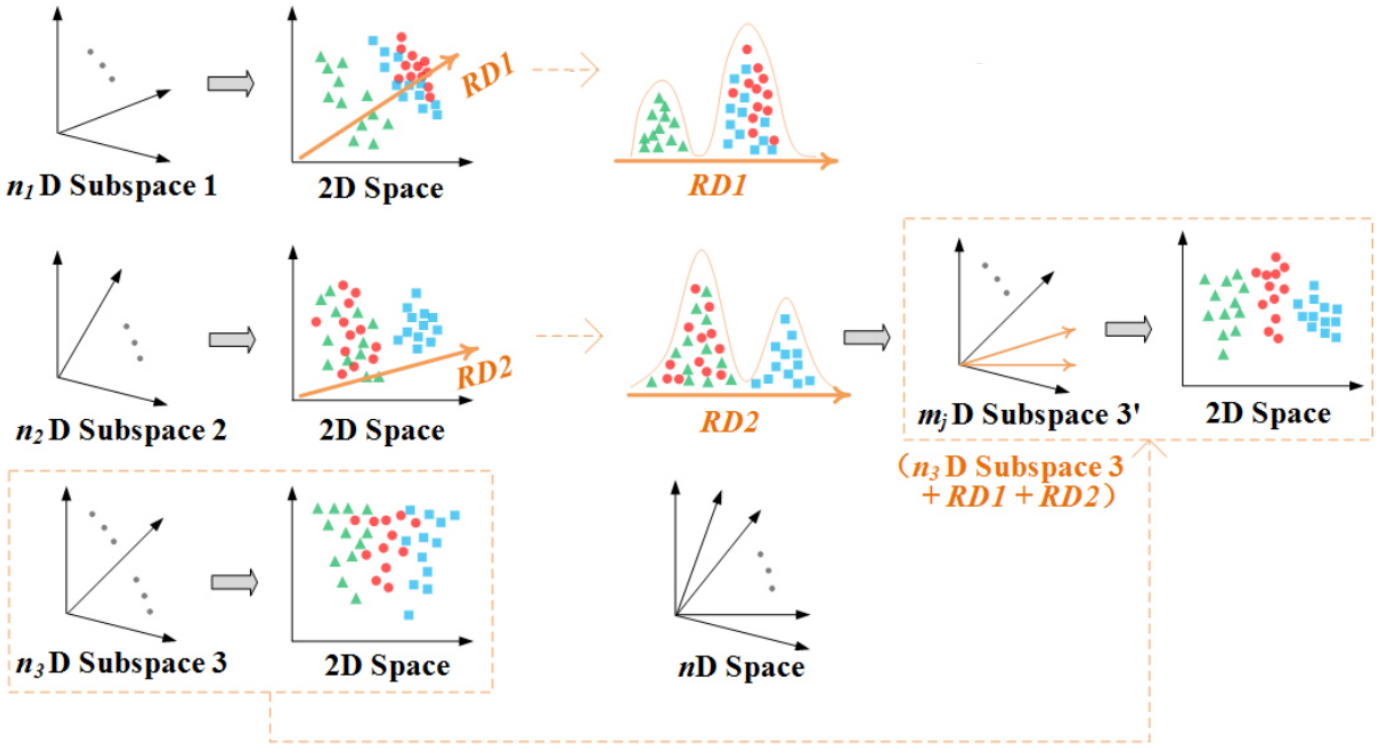
The matrix/tree design is effective in exploring axis-aligned subspaces, which contains only dimensions in the original data. But there are also the composite dimensions, who are weighted sums of the original ones. They form the non-axis-aligned subspaces, where data features may also exist. We propose an interactive method to help users find clusters in the non-axis-aligned subspaces [2]. The idea is illustrated in the image below.

First, we allow the user to explore subspaces by observing their 2D projections. He may find some direction in the 2D plane, along which the different clusters can be well separated. He can keep the direction as a new composite dimension, like RD1 for example. Then he can interactively construct another new dimension RD2, for separating another two clusters. When the composite dimensions are added into an original subspace, the previously found clusters can also be well separated. This method helps users find clusters in the non-axis-aligned subspaces, which is hard to achieve in traditional analysis.
Citation
Xiaoru Yuan, Donghao Ren, Zuchao Wang, and Cong Guo.
Dimension Projection-Matrix/Tree: Interactive Subspace Visual Exploration and Analysis of High Dimensional Data. IEEE Transactions on Visualization and Computer Graphics (InfoVis'13), 19(12):2625-2633, 2013.
| Paper: pdf (8.7 MB) | Video: mp4 (24.0 MB) |Fangfang Zhou, Juncai Li, Wei Huang, Ying Zhao, Xiaoru Yuan, Xing Liang, and Yang Shi.
Dimension Reconstruction for Visual Exploration of Subspace Clusters in High-dimensional Data. In proceedings of IEEE Pacific Visualization Symposium (PacificVis 2016), pages 128-135, Taipei, Apr. 19-22, 2016.
| Paper: pdf (2.9 MB) | Video: wmv (38.0 MB) |