PKU Scientific Visulizatoin System
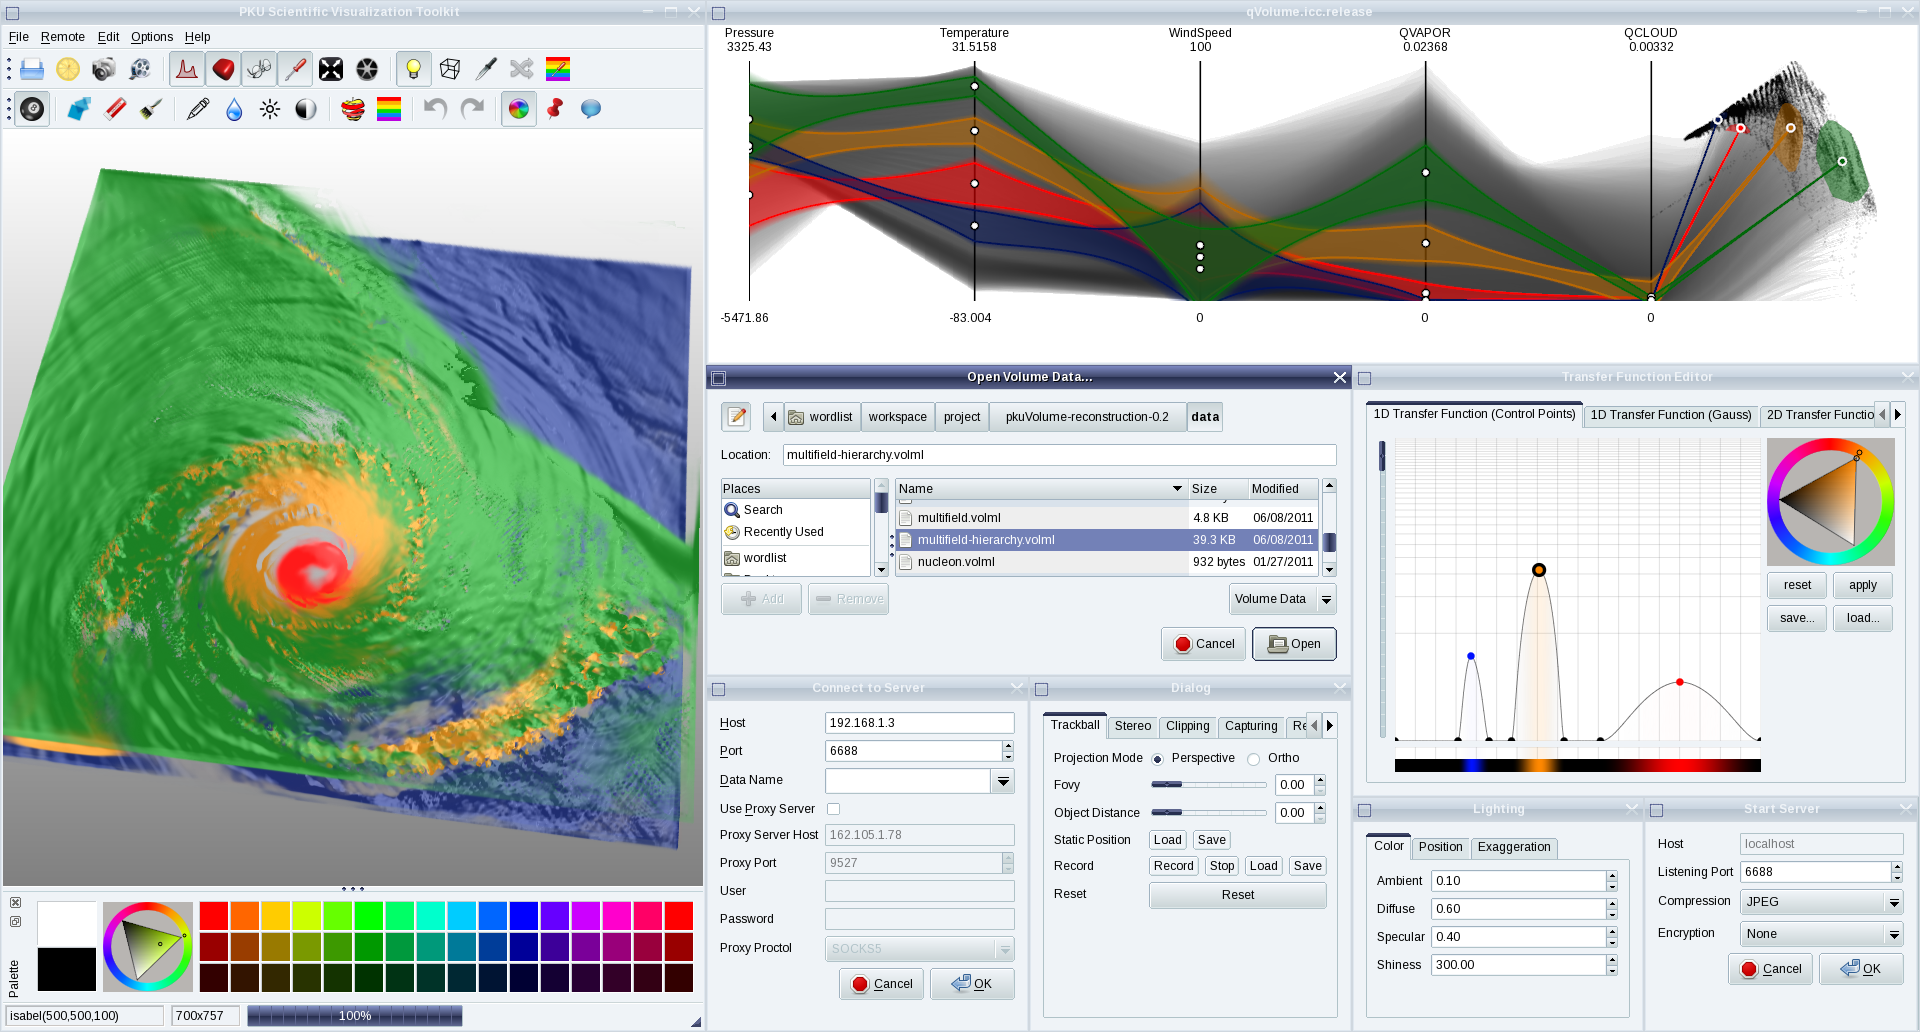
System Interface
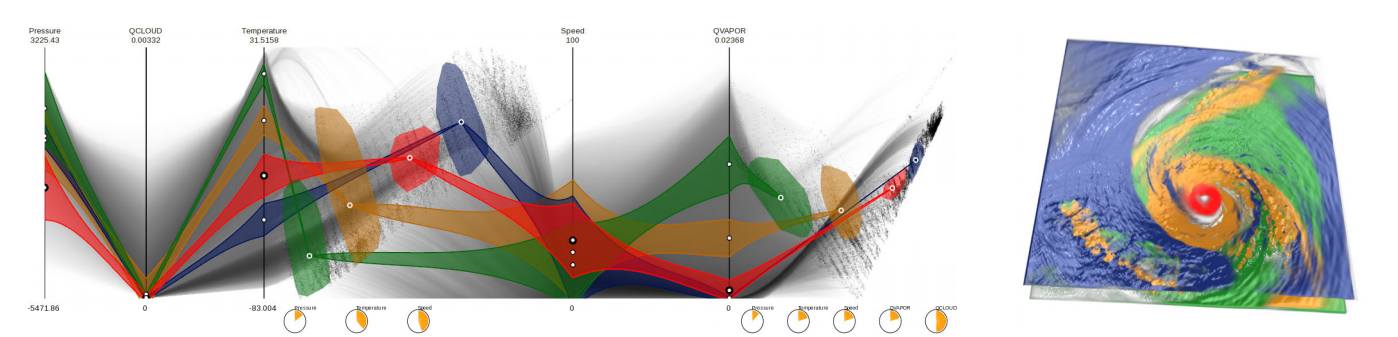
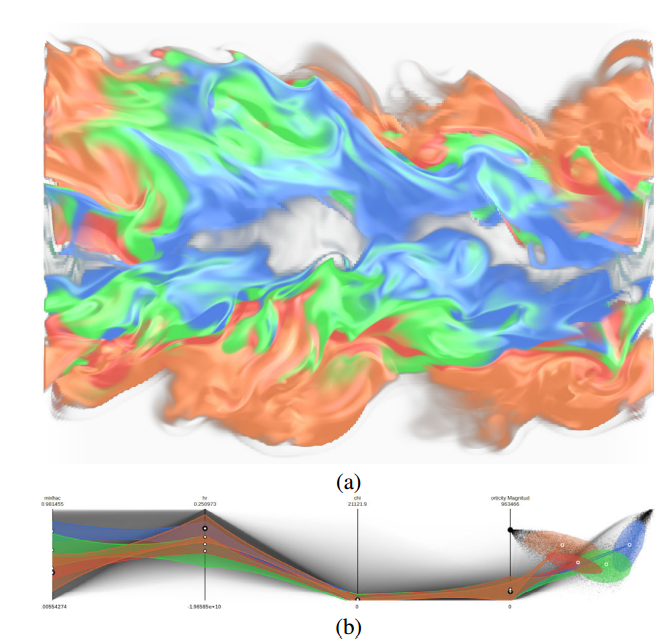
Multi-Dimensional Transfer Function Design based on Flexible Dimension Projection Embedded in Parallel Coordinates
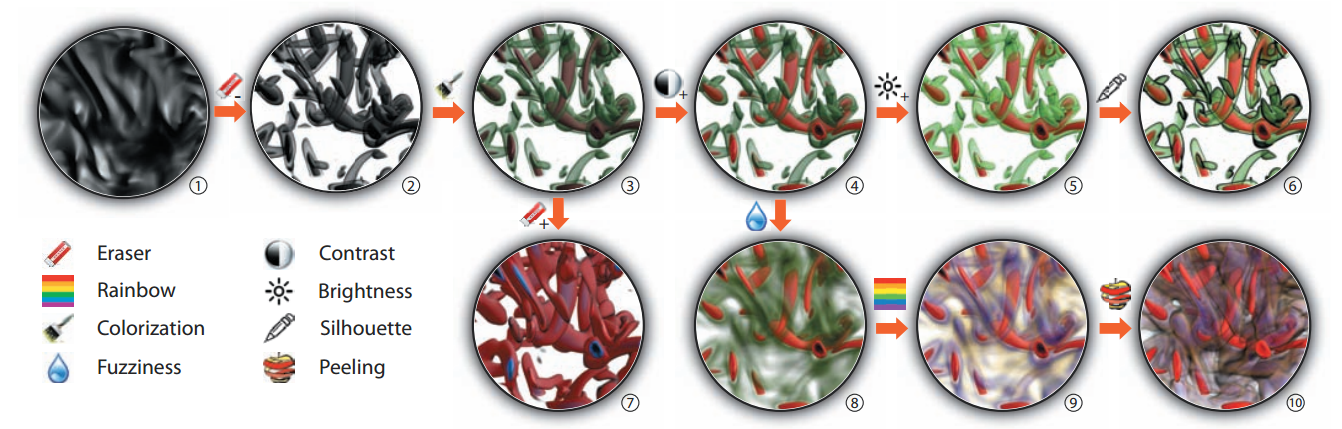
WYSIWYG (What You See is What You Get) Volume Visualization
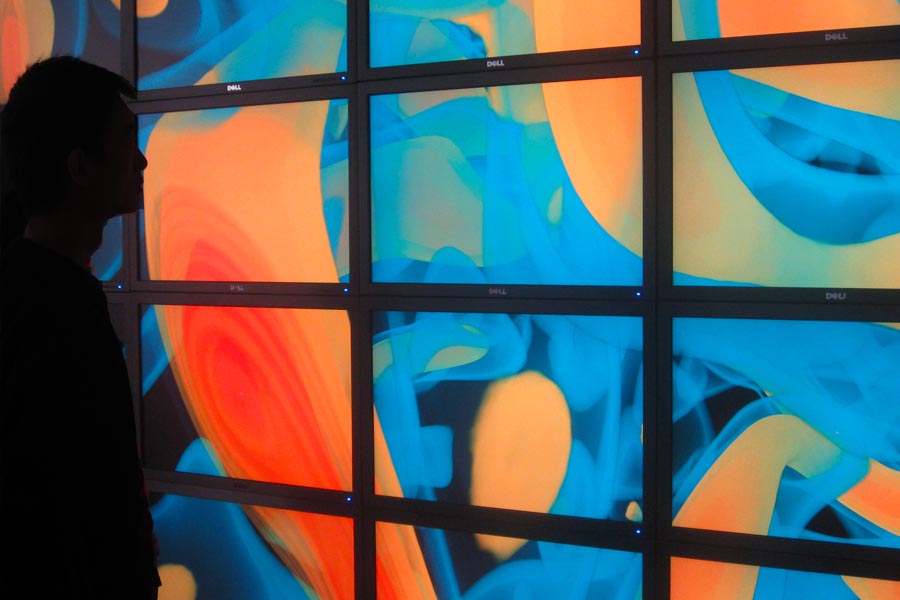
Tiled-display wall
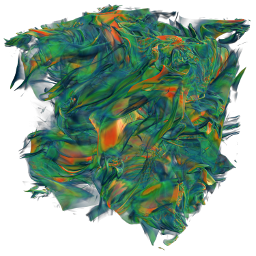
Turbulence Visualization
Combustion visualization
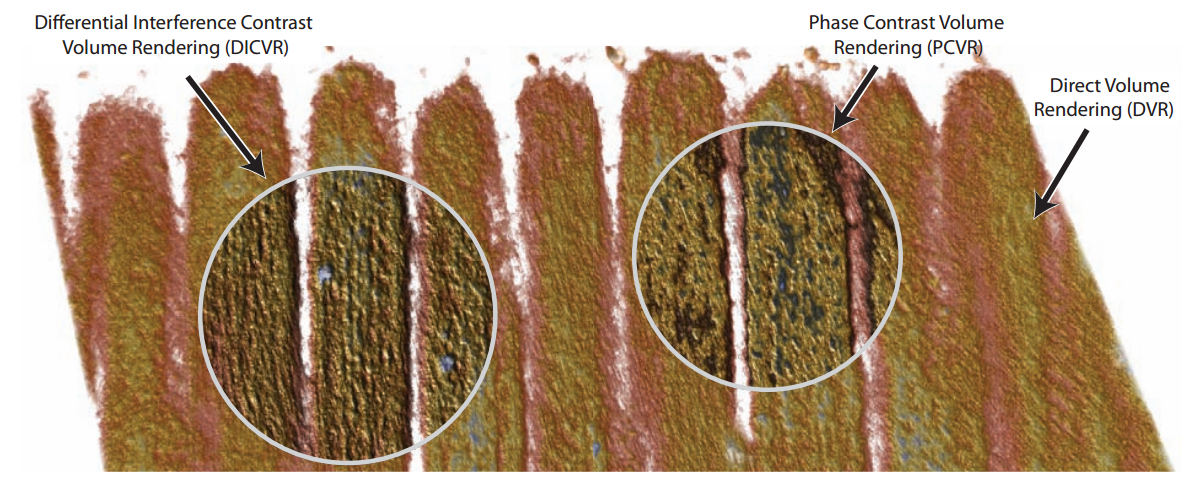
Visualization results of a mouse intestine microvilli data set with lens of DICVR (Differential Interference Contrast Volume Rendering) and PCVR (Phase-Contrast Volume Rendering) in the context of DVR (Direct Volume Rendering).
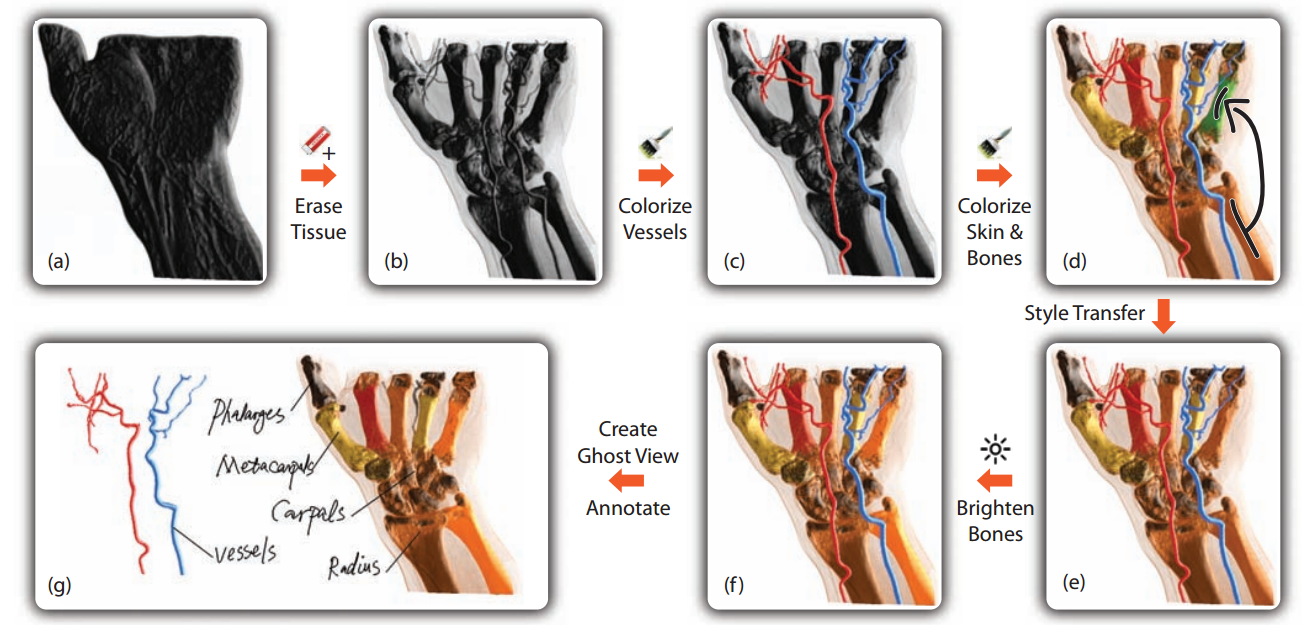
A CT scan of a hand explored and visualized using our Local WYSIWYG Volume Visualization System.
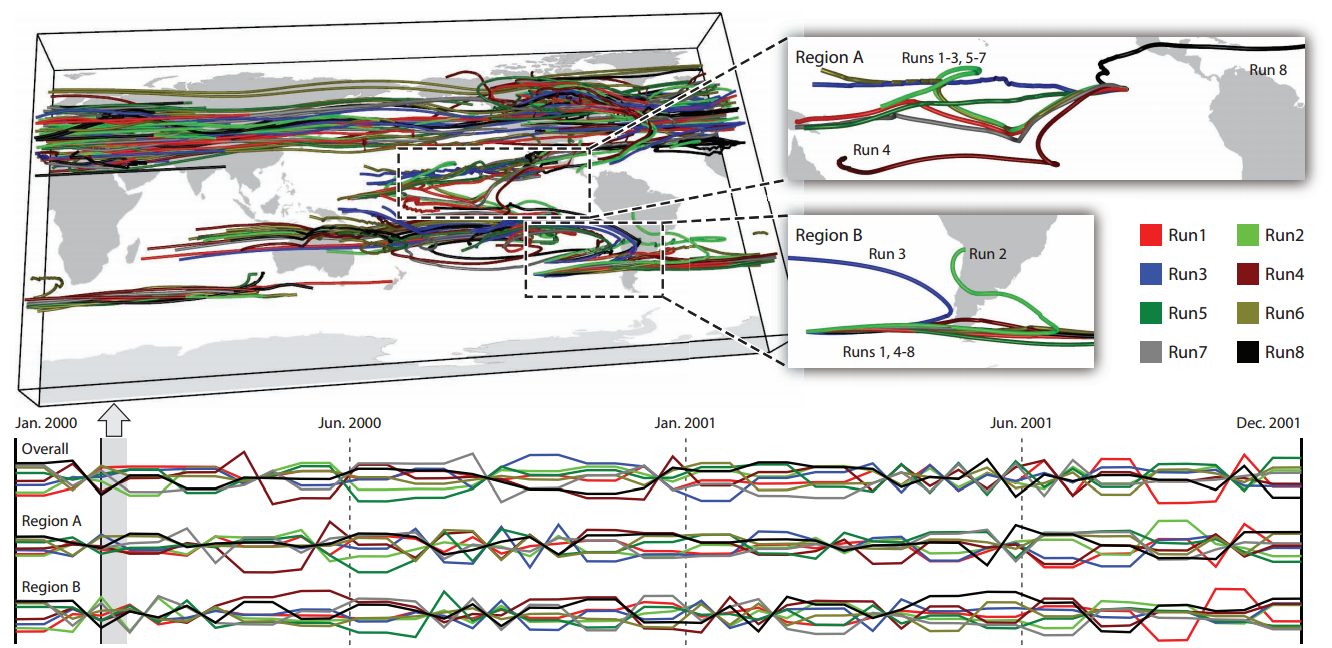
Visualization results of GEOS-5 ensemble simulation data.
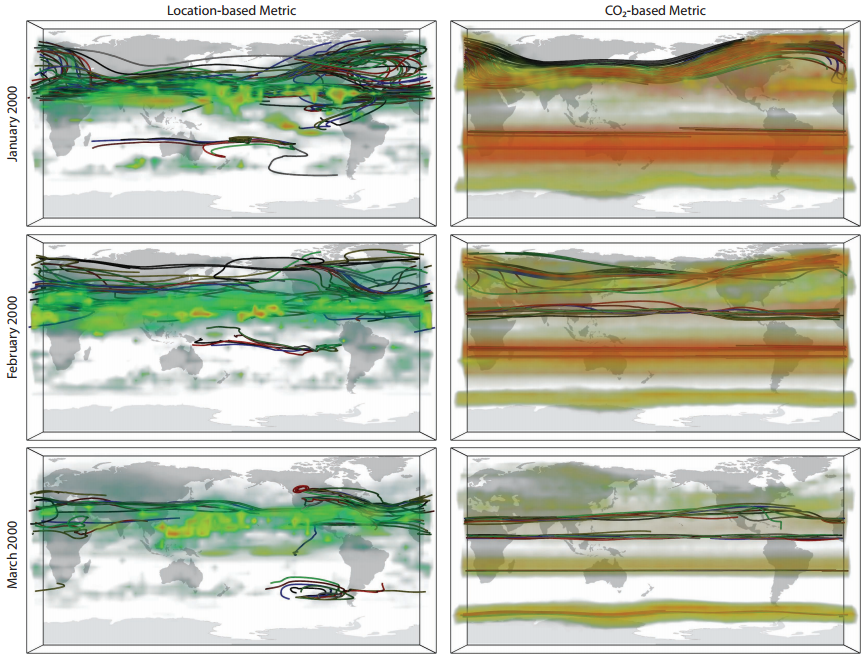
The volume rendered variation field and the filtered field lines of three consecutive months of GEOS-5 simulation data.
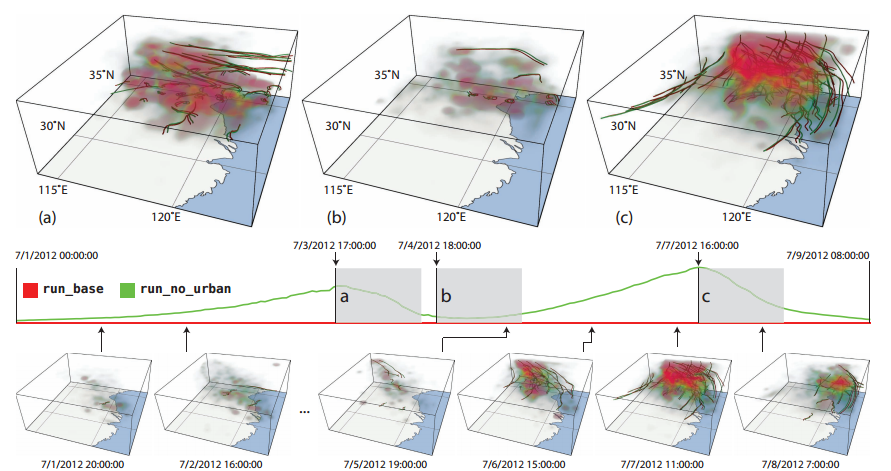
The volume rendered variation field and the filtered field lines of the WRF simulation data.