EnsembleGraph: Interactive Visual Analysis of Spatiotemporal Behaviors in Ensemble Simulation Data
Abstract
This paper presents a novel visual analysis tool, EnsembleGraph, which aims at helping scientists understand spatiotemporal similarities across runs in time-varying ensemble simulation data. We abstract the input data into a graph, where each node represents a region with similar behaviors across runs and nodes in adjacent time frames are linked if their regions overlap spatially. The visualization of this graph, combined with multiple-linked views showing details, enables users to explore, select, and compare the extracted regions that have similar behaviors. The driving application of this paper is the study of regional emission influences over tropospheric ozone, based on the ensemble simulations conducted with different anthropogenic emission absences using MOZART-4. We demonstrate the effectiveness of our method by visualizing the MOZART-4 ensemble simulation data and evaluating the relative regional emission influences on tropospheric ozone concentrations.
Keywords: Ensemble simulation, graph visualization
Figures
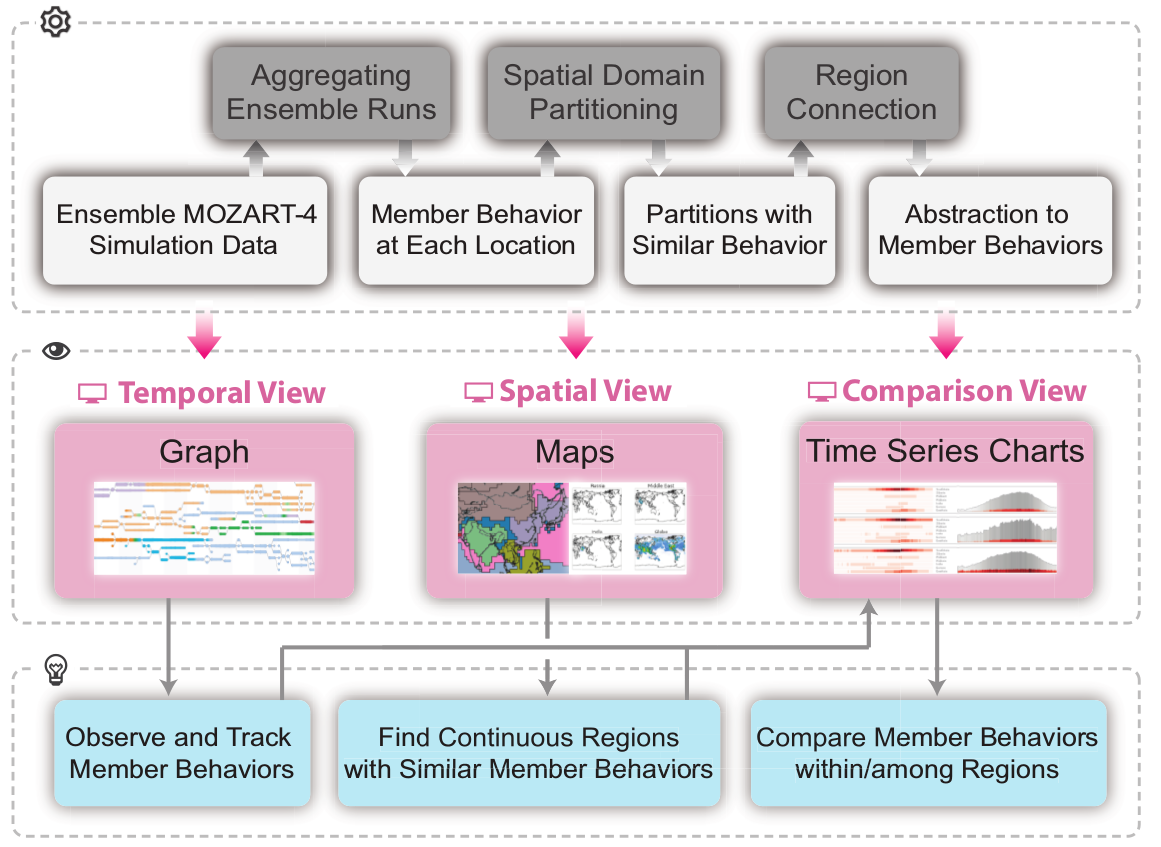
Figure 1. Overview of the EnsembleGraph visual analysis framework. The first row is the data preprocessing part: we do partitioning and region tracking for the data domain to provide overall summarization. The second row is our interface including three main components. The temporal view shows regions of similar ensemble behavior over time; the spatial view shows partitioning results as well as spatial patterns of individual runs; and the comparison view visualizes emission influences of highlighted subregions for validation. The third row is the exploration flow.
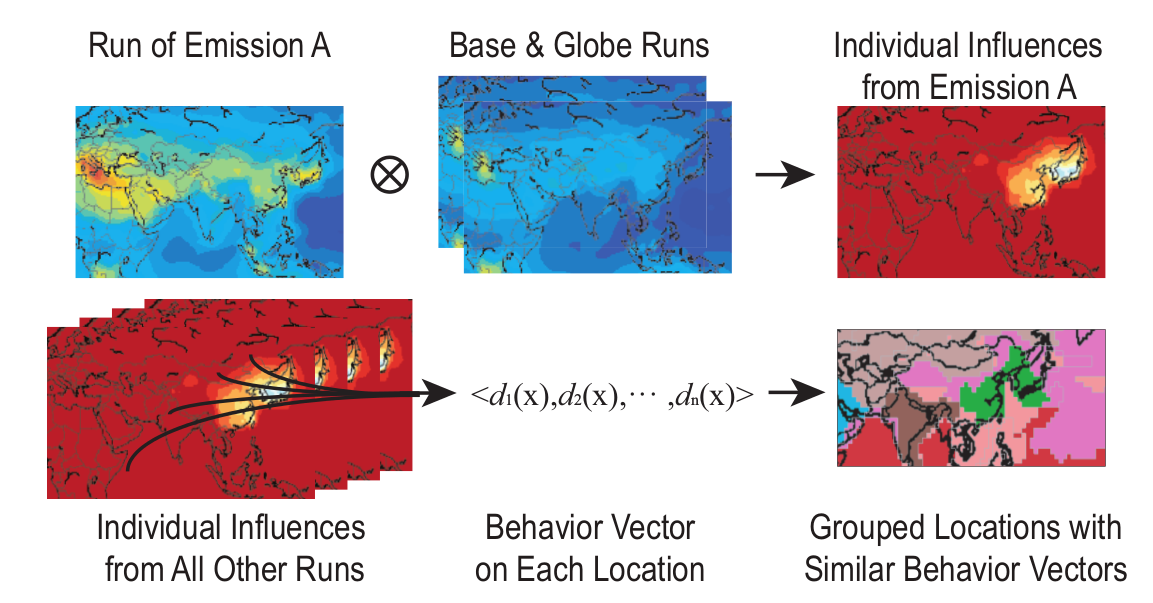
Figure 2. Partitioning ensemble domain according to the behavior vectors on each location. First, we calculate the behavior vector on each location according to the BASE run and the perturbation runs to quantify behavior of ensemble on each location using a vector. Then we classify all behavior vectors by clustering methods and use this result for ensemble domain partitioning.
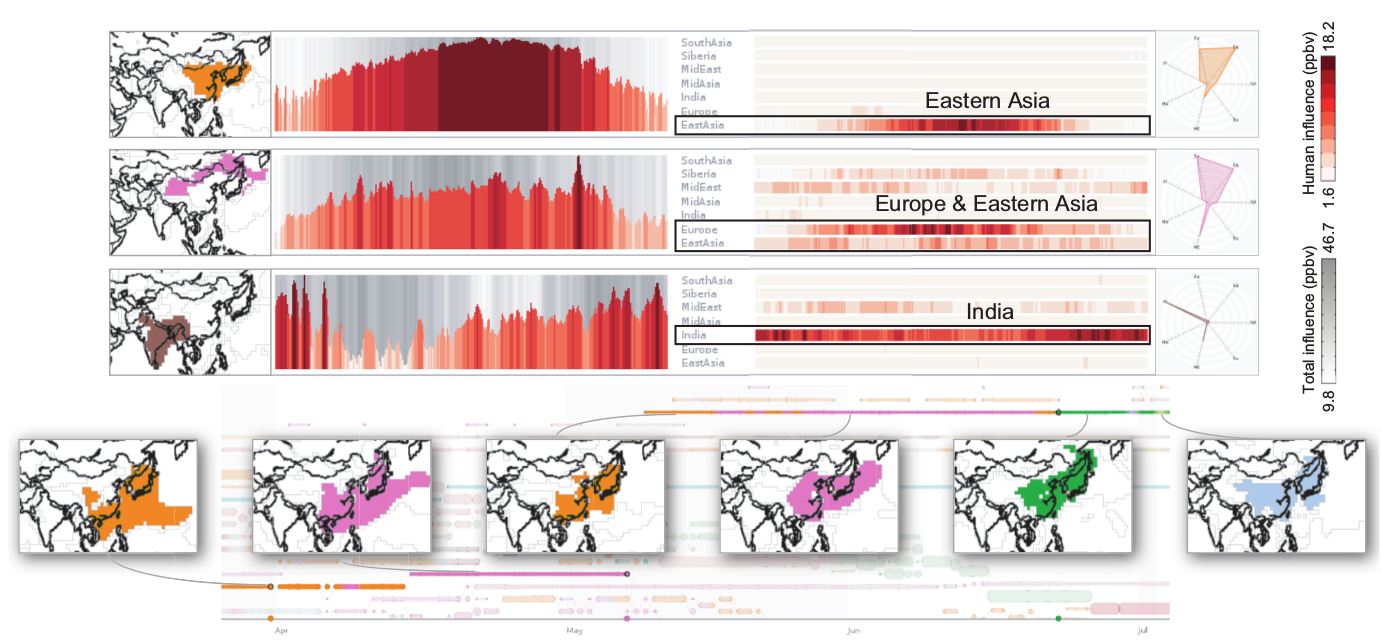
Figure 3. Use case of EnsembleGraph to indicate the influences of Eurasian continent emisions on the surface ozone concentration over eastern Asia. According to similar behaviors between ensemble members over space and time, the neighborhood is partitioned into three parts (left thumbnails in the first three rows): eastern China, southwestern China, and northwestern China. Our novel graph-based interface provides an abstraction of the grouped regions. Users can therefore navigate and track regions of interest over space and time. The last row shows tracking partitioned over southeastern China using a graph view and linked spatial view. Users highlight regions for further analysis in the comparison view, where they compare values between individual runs and behavior similarities between ensembles over different subregions (charts in the first three rows).
Citation
Qingya Shu, Hanqi Guo, Jie Liang, Limei Che, Junfeng Liu, and Xiaoru Yuan. EnsembleGraph: Interactive Visual Analysis of Spatiotemporal Behaviors in Ensemble Simulation Data. In Proceedings of IEEE Pacific Visualization Symposium (PacificVis 2016), pages 56-63, Taipei, Apr. 19-22, 2016.
BibTeX
@Article{Shu2016,
Title     = {EnsembleGraph: Interactive Visual Analysis of Spatiotemporal Behaviors in Ensemble Simulation Data},
Author    = {Qingya Shu, Hanqi Guo, Jie Liang, Limei Che, Junfeng Liu, and Xiaoru Yuan},
Booktitle = {Proceedings of {IEEE} Pacific Visualization Symposium 2016},
Year      = {2016},
Pages     = {56--63},
Bibsource = {dblp computer science bibliography, http://dblp.org}
}