GoTree: A Grammar of Tree Visualizations
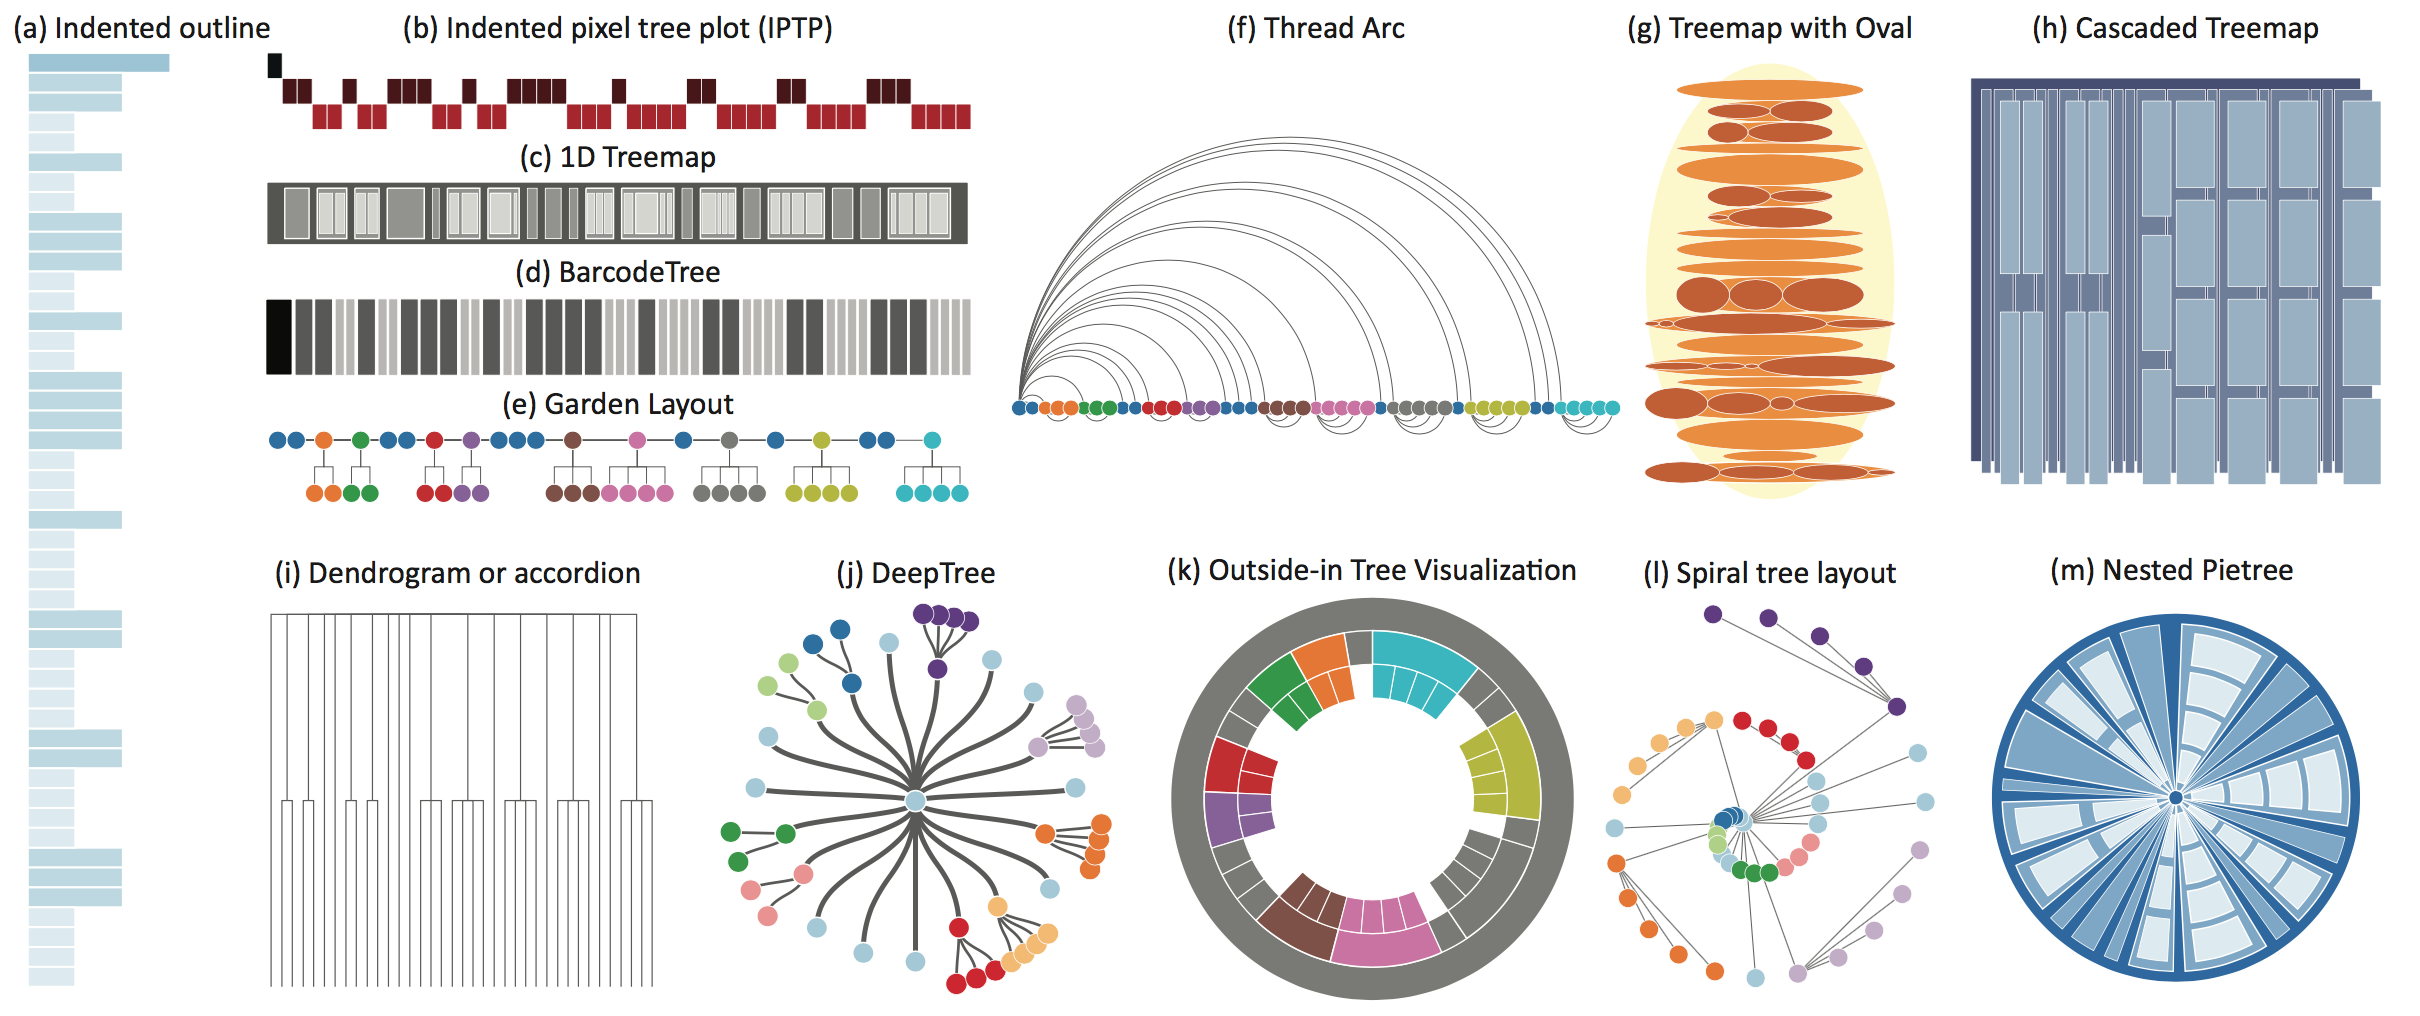
We present GoTree, a declarative grammar allowing users to instantiate tree visualizations by specifying three aspects: visual elements, layout, and coordinate system. Within the set of all possible tree visualization techniques, we identify a subset of techniques that are both “unit-decomposable” and “axis-decomposable” (terms we define). For tree visualizations within this subset, GoTree gives the user flexible and fine-grained control over the parameters of the techniques, supporting both explicit and implicit tree visualizations. We developed Tree Illustrator, an interactive authoring tool based on GoTree grammar. Tree Illustrator allows users to create a considerable number of tree visualizations, including not only existing techniques but also undiscovered and hybrid visualizations. We demonstrate the expressiveness and generative power of GoTree with a gallery of examples and conduct a qualitative study to validate the usability of Tree Illustrator.
Click here to see more.
BarcodeTree: Scalable Comparison for Multiple Hierarchies
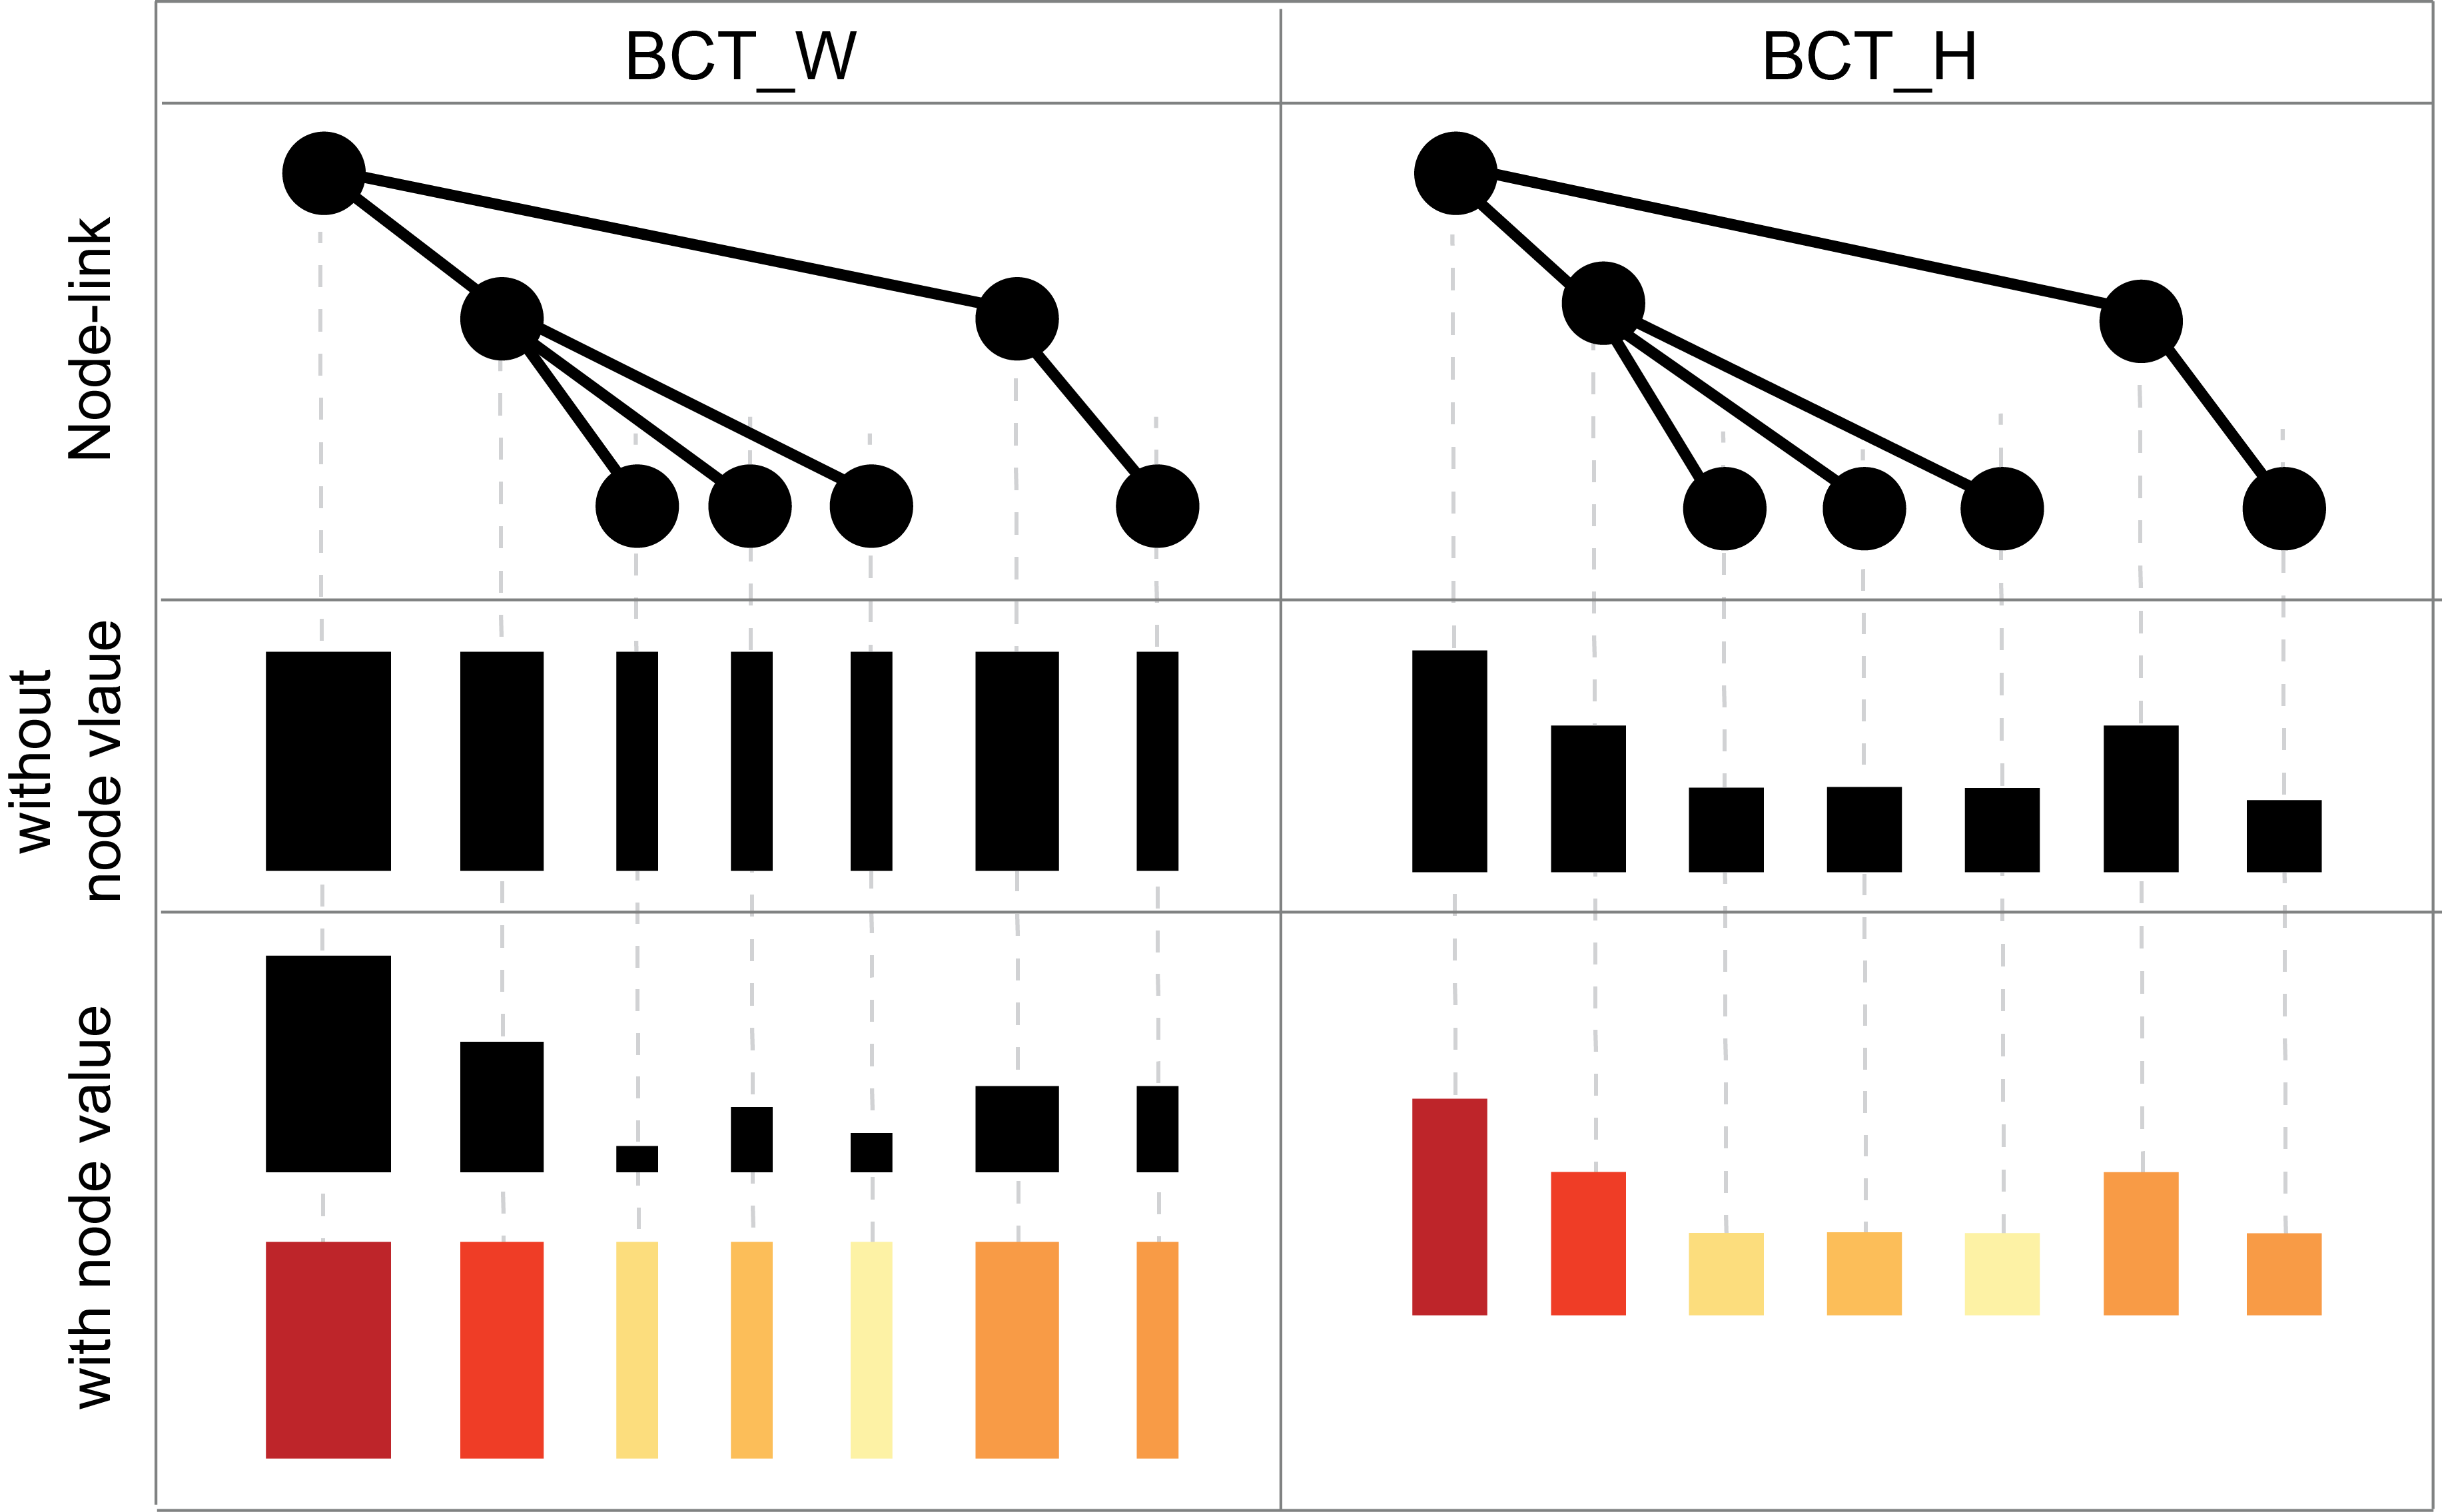
We propose BarcodeTree (BCT), a novel tree visualization technique for comparing hierarchical structure and node attribute values over dozens of trees. Our approach draws each tree within a single row using a style similar to a barcode, allowing dozens of trees to be stacked vertically and viewed simultaneously, with matching nodes aligned horizontally for comparison. We also introduce “structural cues” to help users understand the hierarchical structure of a BarcodeTree. An experiment compared two variants of BarcodeTree with Icicle plots. Results suggest that BCTs make it somewhat more difficult to understand the topology of a tree, but also make it easier to visually compare many trees by reducing the vertical distance between different trees. We developed an online multiple tree comparison system based on the university library record datasets and demonstrate to facilitate the identification of the variation patterns in book borrowing dataset.
Click here to see more.
Graph-based Interactive Visual Analysis of Spatiotemporal Behaviors in Ensemble Simulation Data
We presents a novel visual analysis tool, EnsembleGraph, which aims at helping scientists understand spatiotemporal similarities across runs in time-varying ensemble simulation data. We abstract the input data into a graph, where each node represents a region with similar behaviors across runs and nodes in adjacent time frames are linked if their regions overlap spatially. The visualization of this graph, combined with multiple-linked views showing details, enables users to explore, select, and compare the extracted regions that have similar behaviors. The driving application of this paper is the study of regional emission influences over tropospheric ozone, based on the ensemble simulations conducted with different anthropogenic emission absences using MOZART-4. We demonstrate the effectiveness of our method by visualizing the MOZART-4 ensemble simulation data and evaluating the relative regional emission influences on tropospheric ozone concentrations.
Click here to see more.
Laplacian-based Dynamic Graph Visualization
Visualizing dynamic graphs are challenging due to the difficulty to preserving a coherent mental map of the changing graphs. In this paper, we propose a novel layout algorithm which is capable of maintaining the overall structure of a sequence graphs. Through Laplacian constrained distance embedding,our method works on-line and maintains the aesthetic of individual graphs and the shape similarity between adjacent graphs in the sequence. By preserving the shape of the same graph components across different time steps, our method can effectively help users track and gain insights into the graph changes.
Click here to see more.
PIWI: Visually Exploring Graphs Based on Their Community Structure
Community structure is an important characteristic of many realnetworks, which shows high concentrations of edges within special groupsof vertices and low concentrations between these groups. Community related graph analysis, such as discovering relationships among communities, identifying attribute-structure relationships, andselecting a large number of vertices with desired structural features and attributes, are common tasks in knowledge discovery in such networks. In this paper, we propose a novel visual analytics tool named PIWI. It enables users to conduct the aforementioned community related tasks effectively. It employs uncluttered, intuitive, and yet meaningful visual representations and interactions to support effective and efficient visual exploration of graphs with thousands of vertices.
Click here to see more.
Intelligent Graph Layout Using Many Users' Input
We propose a new strategy for graph drawing utilizing layouts of many sub-graphs supplied by a large group of people in a crowd sourcing manner. We developed an algorithm based on Laplacian constrained distance embedding to merge sub-graphs submitted by different users, while attempting to maintain the topological information of the individual input layouts. To faciliate collection of layouts from many people, a light-weight interactive system has been designed to enable convenient dynamic viewing, modification and traversing between layouts. Compared with other existing graph layout algorithms, our approach can achieve more aesthetic and meaningful layouts with high user preference.
Click here to see more.
Douban Movie Vsiualization Online Analysis Tool
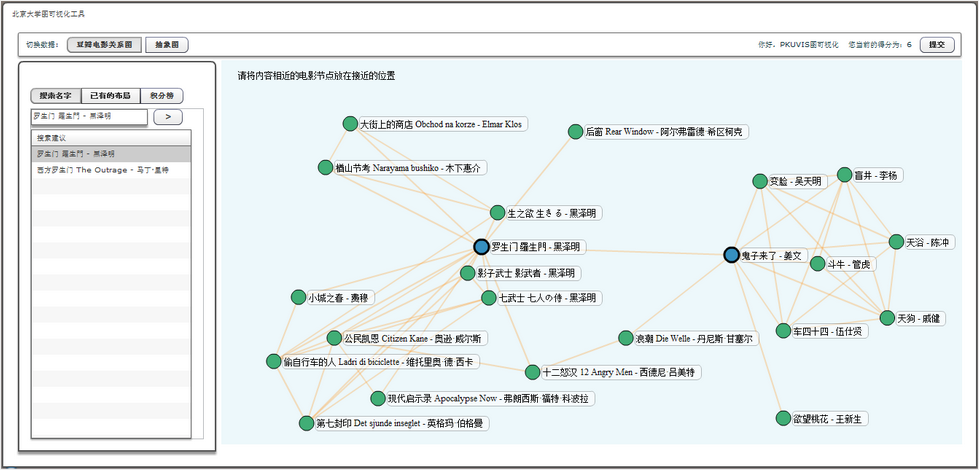
We use graph to represent the similarity relationship between movies, each node is a movie, since there is a recommendation mechanism in Douban, if people like movie A also like movie B, then we build an edge between A and B. Therefore, we can classify the movies by audiences' preference. Based on the rules that similar movies should be close and avoid edge crossings as much as possible, users can edit beautiful and meaningful movie graph layouts. This online visualization tool provides two datasets, one is extracted from Douban Movie website, consist of 15,041 movies, the other is abstract man-made small graph including 50 nodes. Users can alteratively pick one dataset to operate.
Click here to see more.


