Description
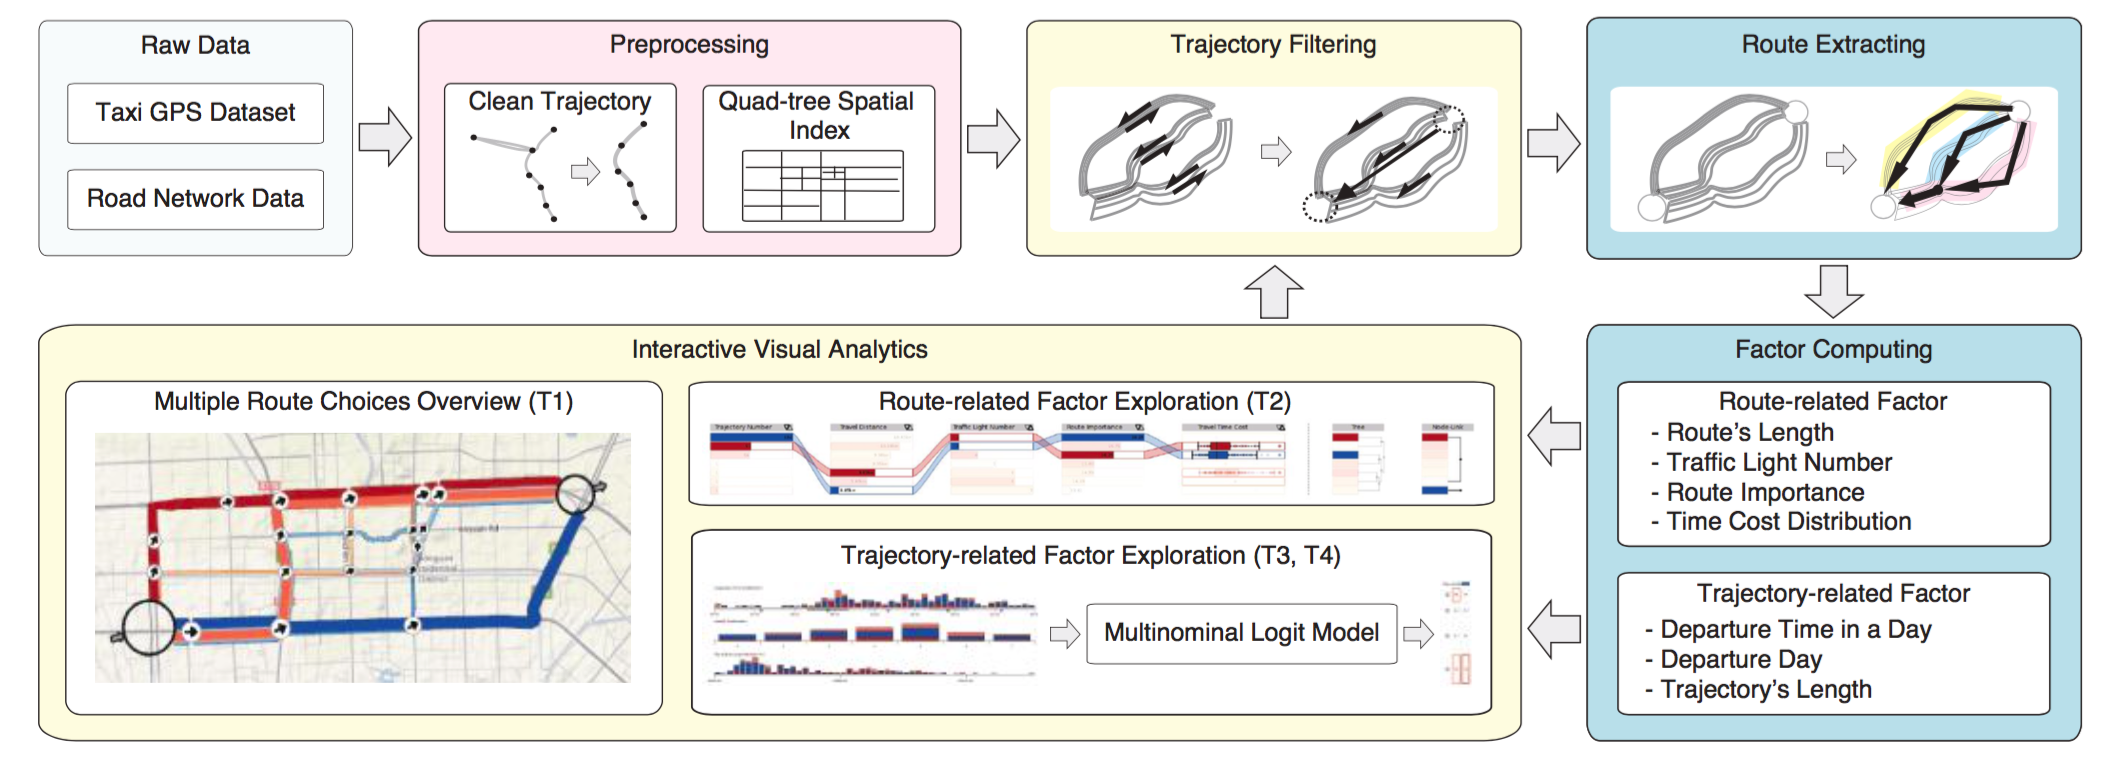
In this project, we propose a visual analytic method to study the route choice behaviour, i.e., how drivers make choice among multiple routes. Interactive trajectory filter allows users to extract routes between interested origin and destination from large scale of trajectories. With a designed ranking diagram and stacked bar chart, users are able to compare multiple routes so that construct hypothesis of potential impacting factors, such as traffic lights, travelling distance, departing time, etc. With the Multinomial Logit Model embedded in the visual analytics, the proposed hypotheses can be verified statistically. Applying to real taxi GPS dataset, several findings in the route choices in Beijing are present to demonstrate the effectiveness of proposed method.
Citation
Min Lu, Chufan Lai, Tangzhi Ye, Jie Liang, and Xiaoru Yuan.
Visual Analysis of Multiple Route Choices Based on General GPS Trajectories.
IEEE Transactions on Big Data, 2017, 3(2): 234-247
Images

Pipeline of Multiple Route Choice Visual Analytics: consists of data preprocessing (pink), automatic computation (blue) and human involved visual analytic module (yellow).

Exploring Route-related Factors of Multiple Routes: exploring route choices from Airport to a commercial district: (a) the spatial overview. (b) three selected popular routes. (c) route-related factors’ comparison among the selected routes.