Description
In trajectory data analysis, data cleaning is often a tough task that requires efforts and expertise. In this paper, we propose a visual analytics approach to help analysts more efficiently define and detect data quality problems in the raw trajectory data. The approach adopts the semi-automatic detection strategy, combining advantages of both visual exploration and automatic classification. Specifically, we transform the trajectory data into a vector space by combining the autoencoder technique with trajectory attributes. A visual analysis system named VDQA is provided to support the analysis of trajectories concerning both the spatiotemporal and vectorized features. Using dimensionality reduction, users are able to quickly identify data with quality problems in the vector space. With the identified anomalies, classification models are trained to efficiently disclose more data with similar problems. Users can further improve the models until satisfied results are gained. We have applied this approach to multiple real-world trajectory datasets. Results prove that our approach does help users identify quality problems in a more efficient way.
Citation
Images

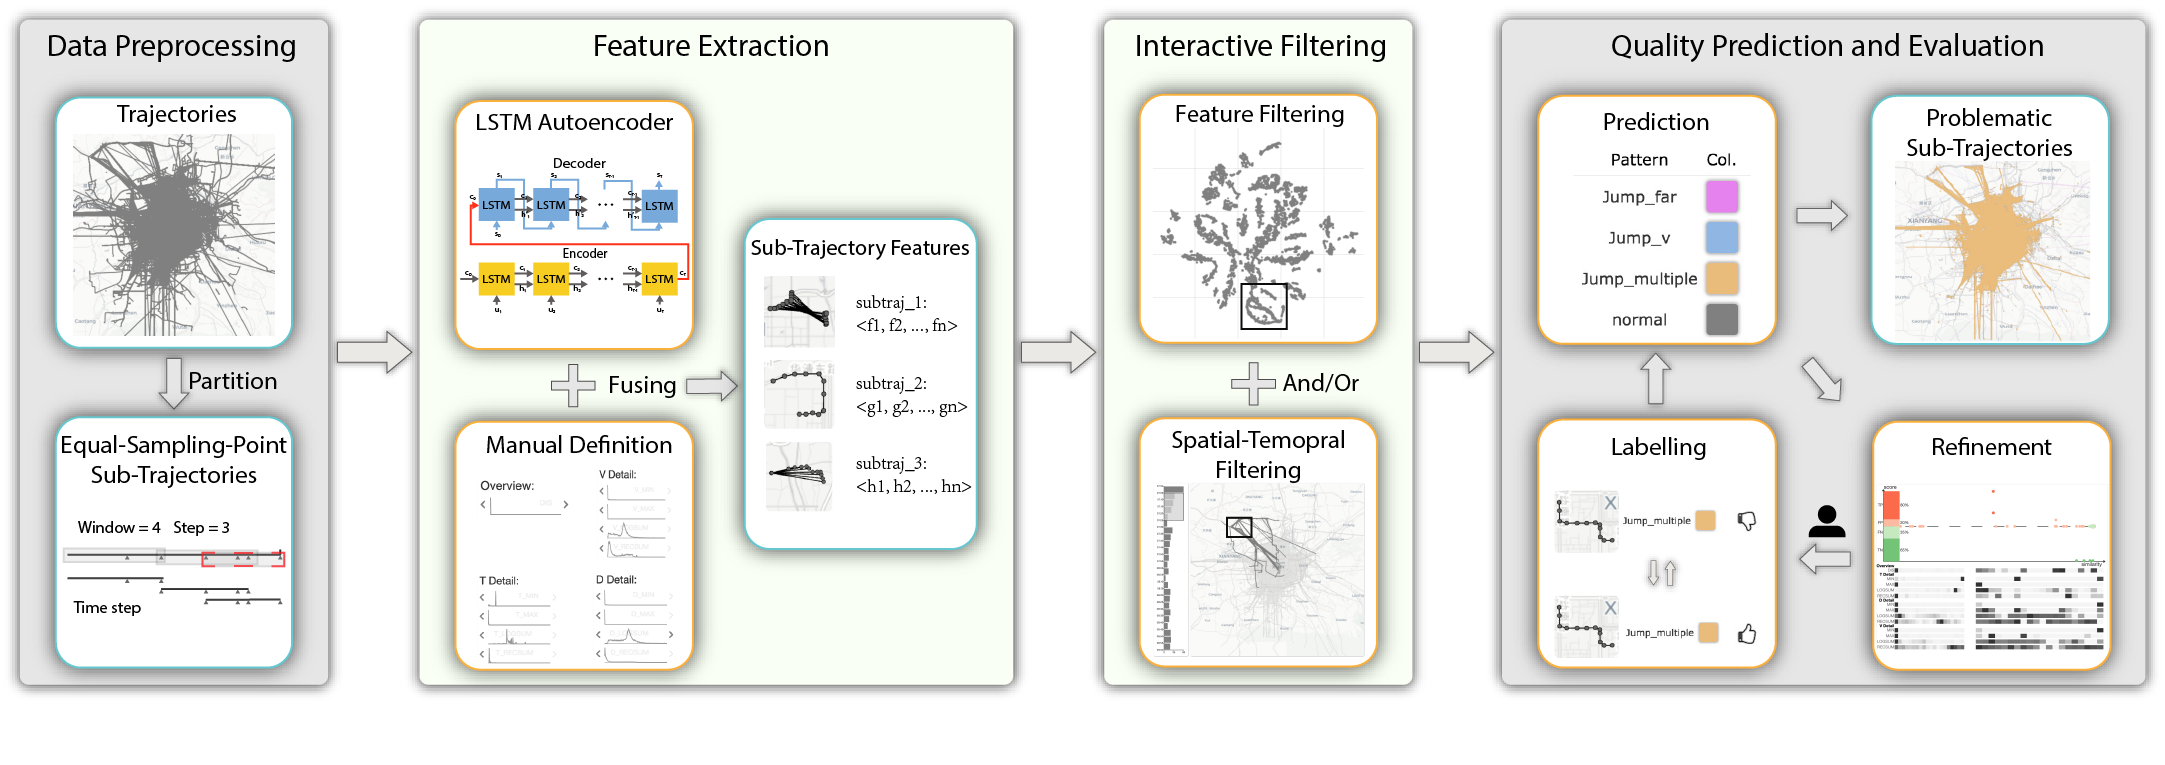
The pipeline of VDQA: after dividing the trajectories into equal-sampling-point sub-trajectories by sliding window, we fuse the LSTM Autoencoder features and manual definition features to characterize them. Then VDQA provides interactive space, time and feature space filtering for data quality labelling. Next, the progressively updated classification model is trained and detects the group with similar data quality problem. The trajectory set is updated by excluding the cleaned sub-trajectories.

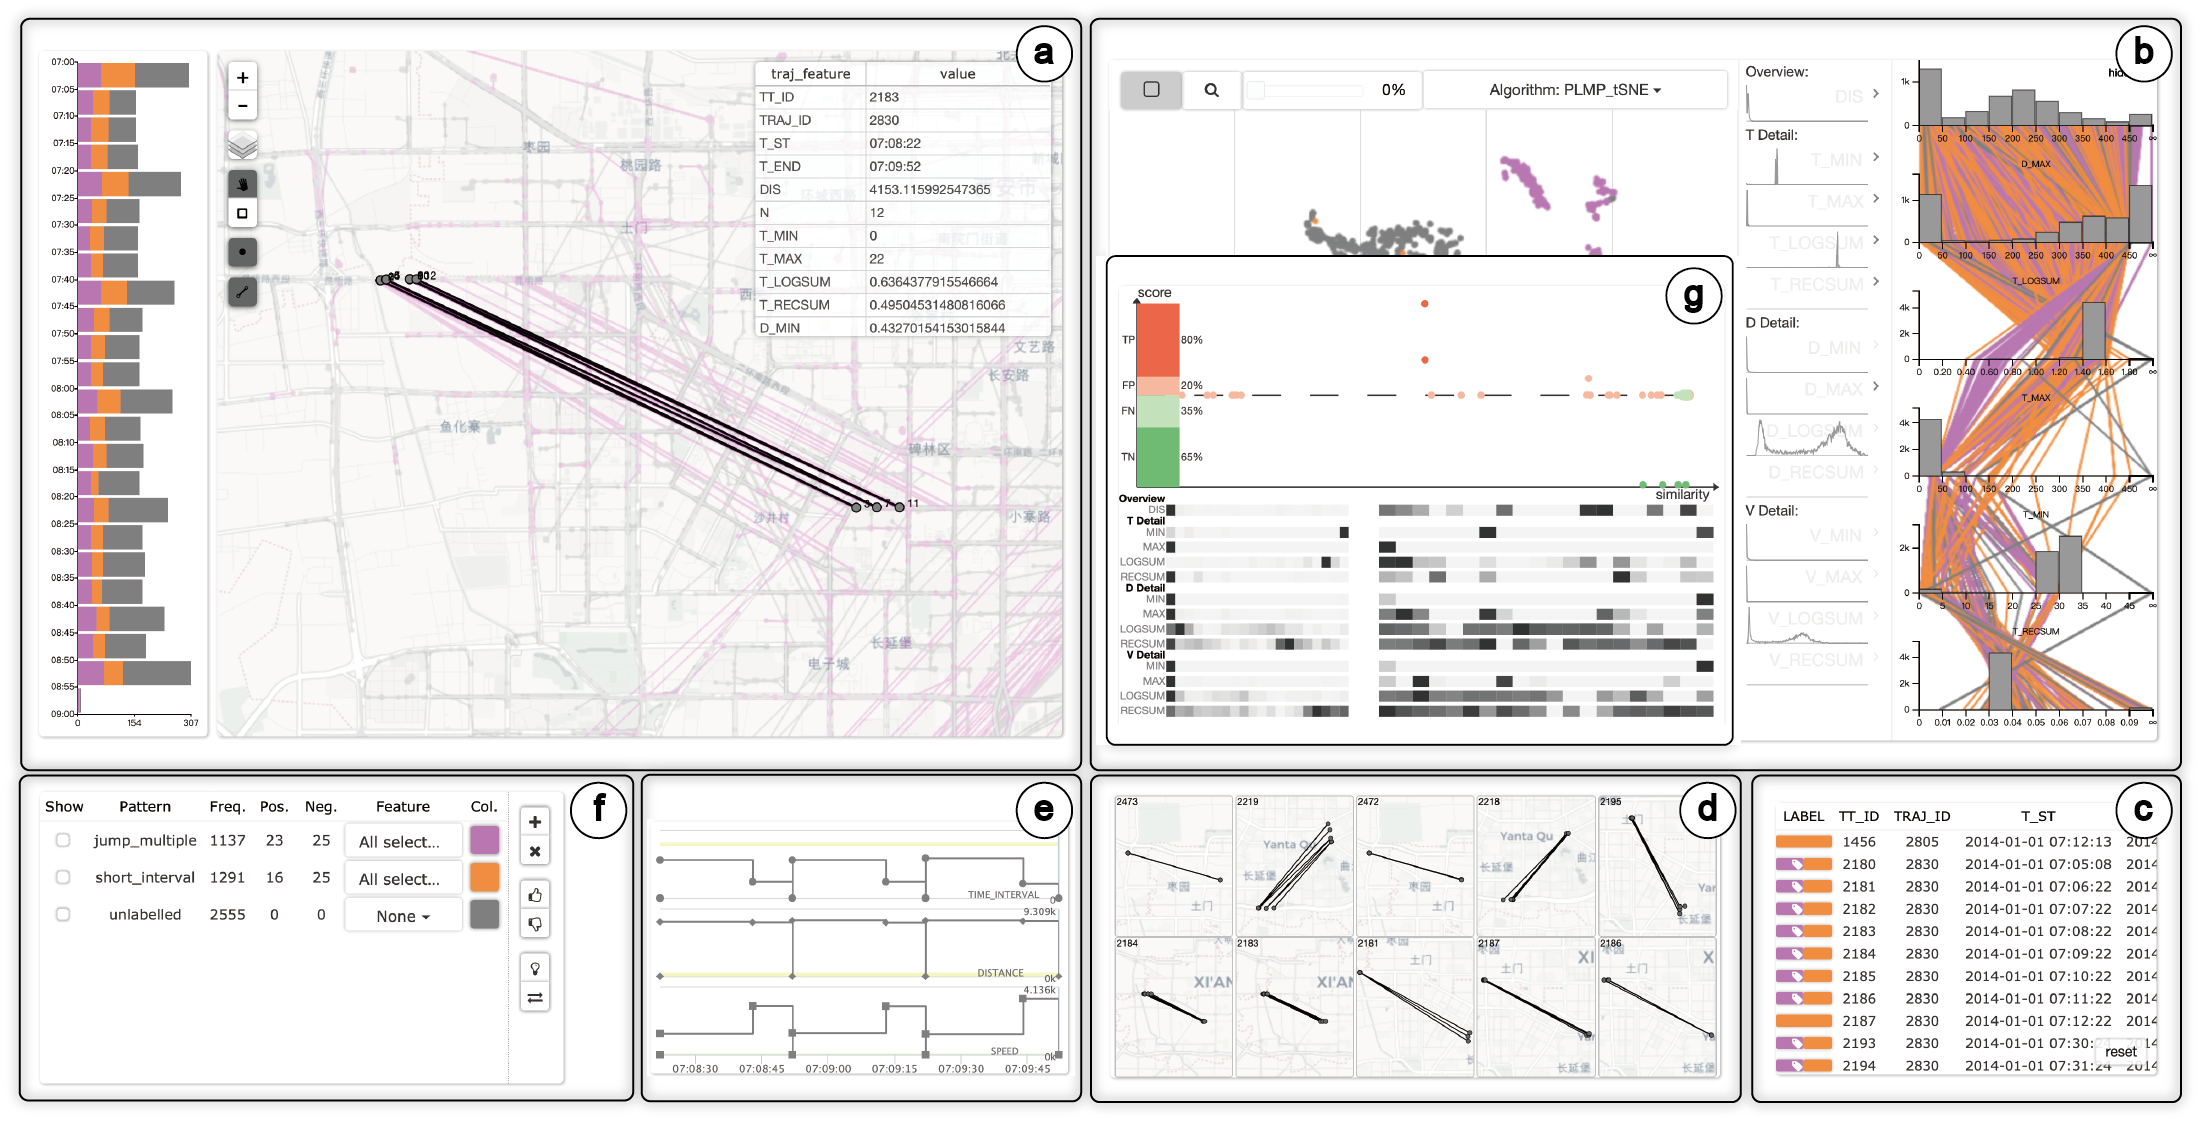
Interface of VDQA: (a) spatial-temporal overview of sub-trajectories with different types of quality problems; (b) high-dimensional plots of trajectory features to support problematic sub-trajectories exploration and identification; (c) list of filtered sub-trajectories; (d) small multiples view which recommends several sub-trajectories similar to the selected one;(e) detailed features distribution over sampling points with the selected sub-trajectory; (f) list of classified trajectory groups with different quality problems; (g) evaluation view of classifier’s results.