Overview
Scientists are generating ever-growing scale of data with supercomputers in this big data era. Visualization has been increasingly important for analyzing, understanding, and revealing insights in data. Our research interests generally involve in scalable visualization and analysis of large scientific data.
The Scalability
In the context of our studies, the "scalability" is not limited to its narrow implications, but also the follows:
- Software scalability. We largely employ and develop parallel and scalable methods to visualize and analyze data on cutting-edge HPC platforms.
- Feature scalability. We meet the challenge of the new data and needs in scientific research, e.g. increading number of variables and ensemble constituents, coupled analysis of scalar and vector attributes, etc.
- Human scalability. We conduct user-centric research to help domain experts to explore and investigate their data with novel user interaction techniques.
Facets of Research
Our research focus on multivariate, multi-valued, and ensemble flow data, which consists of both scalar and vector attributes in the context of our studies. Alternative to traditional flow visualization methods which have been studied for decades, we emphasize on the scalable analysis of indirect and multi-faceted features. We also extensively use both Eulerian and Lagrangian method for the flow data analysis from multiple perspectives.
Multivariate Analysis of Scalar Fields
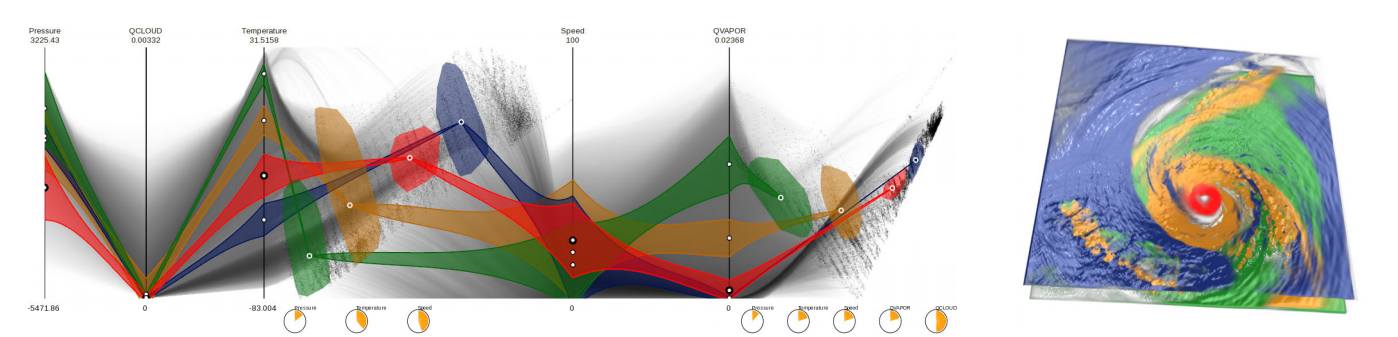
It is challenging to investigate the multivariate features and the correlations between the scalar attributes in real applications. We map the multivariate samples into the seamlessly integrated Parallel Coordinates Plots (PCP) and Multi-Dimensional Projection (MDS) plots for feature identification and selection. The PCP visualizes the numerical distributions for each attribute, and the MDS presents the similarities of the samples. The selected features are further visualized by volume rendering, after Gaussian transfer functions are constructed from user selection. In the case study of a hurricane simulation, the hurricane eye surroundings (red) shows lower pressure, medium temperature, and high wind speed. Various insightful features can be selected and explored in different views. A scalable and parallel system is developed on distributed many-core environments, to accelerate the multivariate volume rendering, PCP rendering, and the MDS computation for the analysis. In the oil exploration application. To find the underground flow path from the scalar intensities collected by seismic devices, is a significant step for oil and gas searching. However, neither the classic volume exploration methods, e.g. transfer function design, nor the traditional volume cut algorithms can be directly used due to its three natural properties, various compositions, discontinuity and noise. Thus new interactive approach to visualize the underground flow path is needed.
- Fan Hong, Can Liu and Xiaoru Yuan
DNN-VolVis: Interactive Volume Visualization Supported by Deep Neural Network. In Proceedings of IEEE Pacific Visualization Symposium (PacificVis 2019), pages 282-291, Bangkok, Thailand. April 23-26, 2019.
| DOI | PDF (4.8 MB) | - Changhe Yang, Yanda Li, Can Liu, and Xiaoru Yuan
Deep Learning based Viewpoint Recommendation in Volume Visualization. Journal of Visualization (ChinaVis 2019), 22(5):991–1003, 2019.
| DOI | PDF (3.7 MB) | - Hanqi Guo, Wei Li, and Xiaoru Yuan
Transfer Function Map. In Proceedings of IEEE Pacific Visualization Symposium (PacificVis 2014), pages 262-266, (Notes Paper), Yokohama, Japan, Mar. 4-7, 2014.
| DOI | PDF (0.2 MB) | - Hanqi Guo, He Xiao, and Xiaoru Yuan
Scalable Multivariate Volume Visualization and Analysis based on Dimension Projection and Parallel Coordinates. IEEE Transactions on Visualization and Computer Graphics, 18(9):1397-1410, 2012.
| DOI | PDF (861 KB) | - Hanqi Guo, He Xiao, and Xiaoru Yuan
Multi-Dimensional Transfer Function Design based on Flexible Dimension Projection Embedded in Parallel Coordinates. In Proceedings of IEEE Pacific Visualization Symposium (PacificVis 2011), pages 19-26, Hong Kong, Mar 1-4, 2011.
| DOI | PDF (1.2 MB) | MPEG4 (5.0 MB) | - Xiaoru Yuan, He Xiao, Hanqi Guo, Peihong Guo, Wesley Kendall, Jian Huang, and Yongxian Zhang
Scalable Multi-variate Analytics of Seismic and Satellite-based Observational Data. IEEE Transactions on Visualization and Computer Graphics, 16(3):1413-1420, 2010.
| DOI | PDF (3.3 MB) |
Multivariate Analysis of Flow Fields
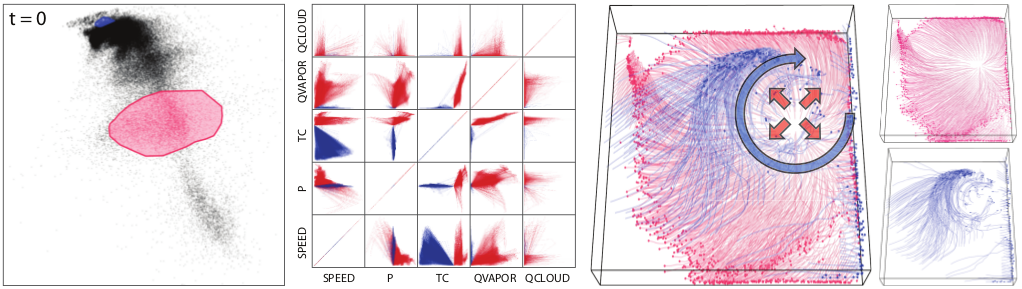
We also couple the multivariate analysis with flow advection, which makes it possible to discover and explain complicated transport phenomena in various studies like carbon footprint, pollution, etc. However, there is a lack of such compound analysis in current flow visualization practice. Lagrangian-based Attribute Space Projection (LASP) helps users identify features with similar pathline attributes. Compared to our multivariate analysis for scalar attributes, which can be categorized as an Eulerian-based method, LASP not only accounts for the scalar values at current location, but also the locations along the pathlines. For example, the orange cluster in the figure demonstrates the transportation process of water vapor to the periphery regions. The water vapor mixing ratio decreases as the particles traverse, meanwhile the temperature and pressure also drop as they go outwards. The projection, which shows the similarities, provides a good entry point for the feature selection and refinement. Due to the high computational cost of LASP, we tightly integrate the MapReduce-style particle tracer DStep [Kendall et al. 2011] and the scalable projection algorithm for large-scale analysis.
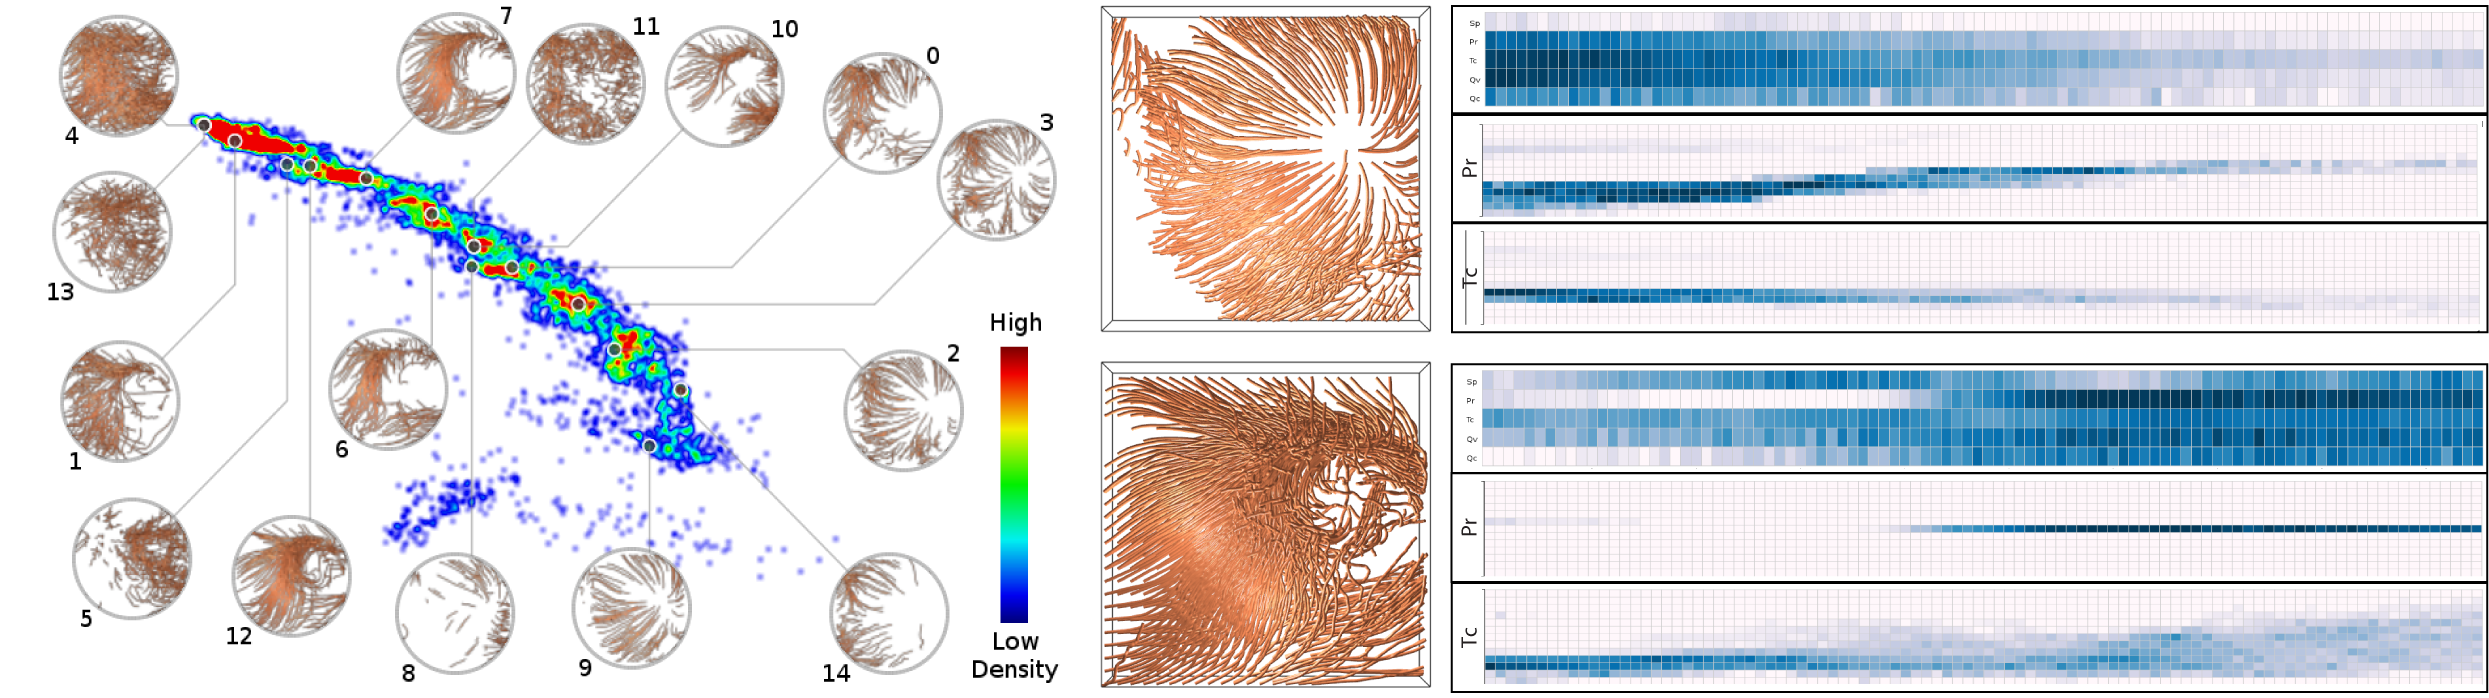
Furthermore, to alleviate the interaction burden of trial-and-error in projection plot, we present a novel feature extraction approach called FLDA for unsteady flow fields based on Latent Dirichlet allocation (LDA) model. Analogous to topic modeling in text analysis, in our approach, pathlines and features in a given flow field are defined as documents and words respectively. Flow topics are then extracted based on Latent Dirichlet allocation Different from other feature extraction methods, our approach clusters pathlines with probabilistic assignment, and aggregates features to meaningful topics at the same time. We build a prototype system to support exploration of unsteady flow field with our proposed LDA-based method Interactive techniques are also developed to explore the extracted topics and to gain insight from the data.
- Hanqi Guo, Fan Hong, Qingya Shu, Jiang Zhang, Jian Huang, and Xiaoru Yuan
Scalable Lagrangian-based Attribute Space Projection for Multivariate Unsteady Flow Data. In Proceedings of IEEE Pacific Visualization Symposium (PacificVis 2014), Yokohama, Japan, Mar. 4-7, 2014. (Accepted)
| DOI | PDF (3.9 MB) | MPEG4 (8.2 MB) | - Fan Hong, Chufan Lai, Hanqi Guo, Enya Shen, Xiaoru Yuan, Sikun Li
FLDA: Latent Dirichlet Allocation Based Unsteady Flow Analysis. IEEE Transactions on Visualization and Computer Graphics (SciVis'14), 20(12):2545-2554, 2014.
| DOI | PDF (4.5 MB) |
Ensemble Scalar Field Analysis
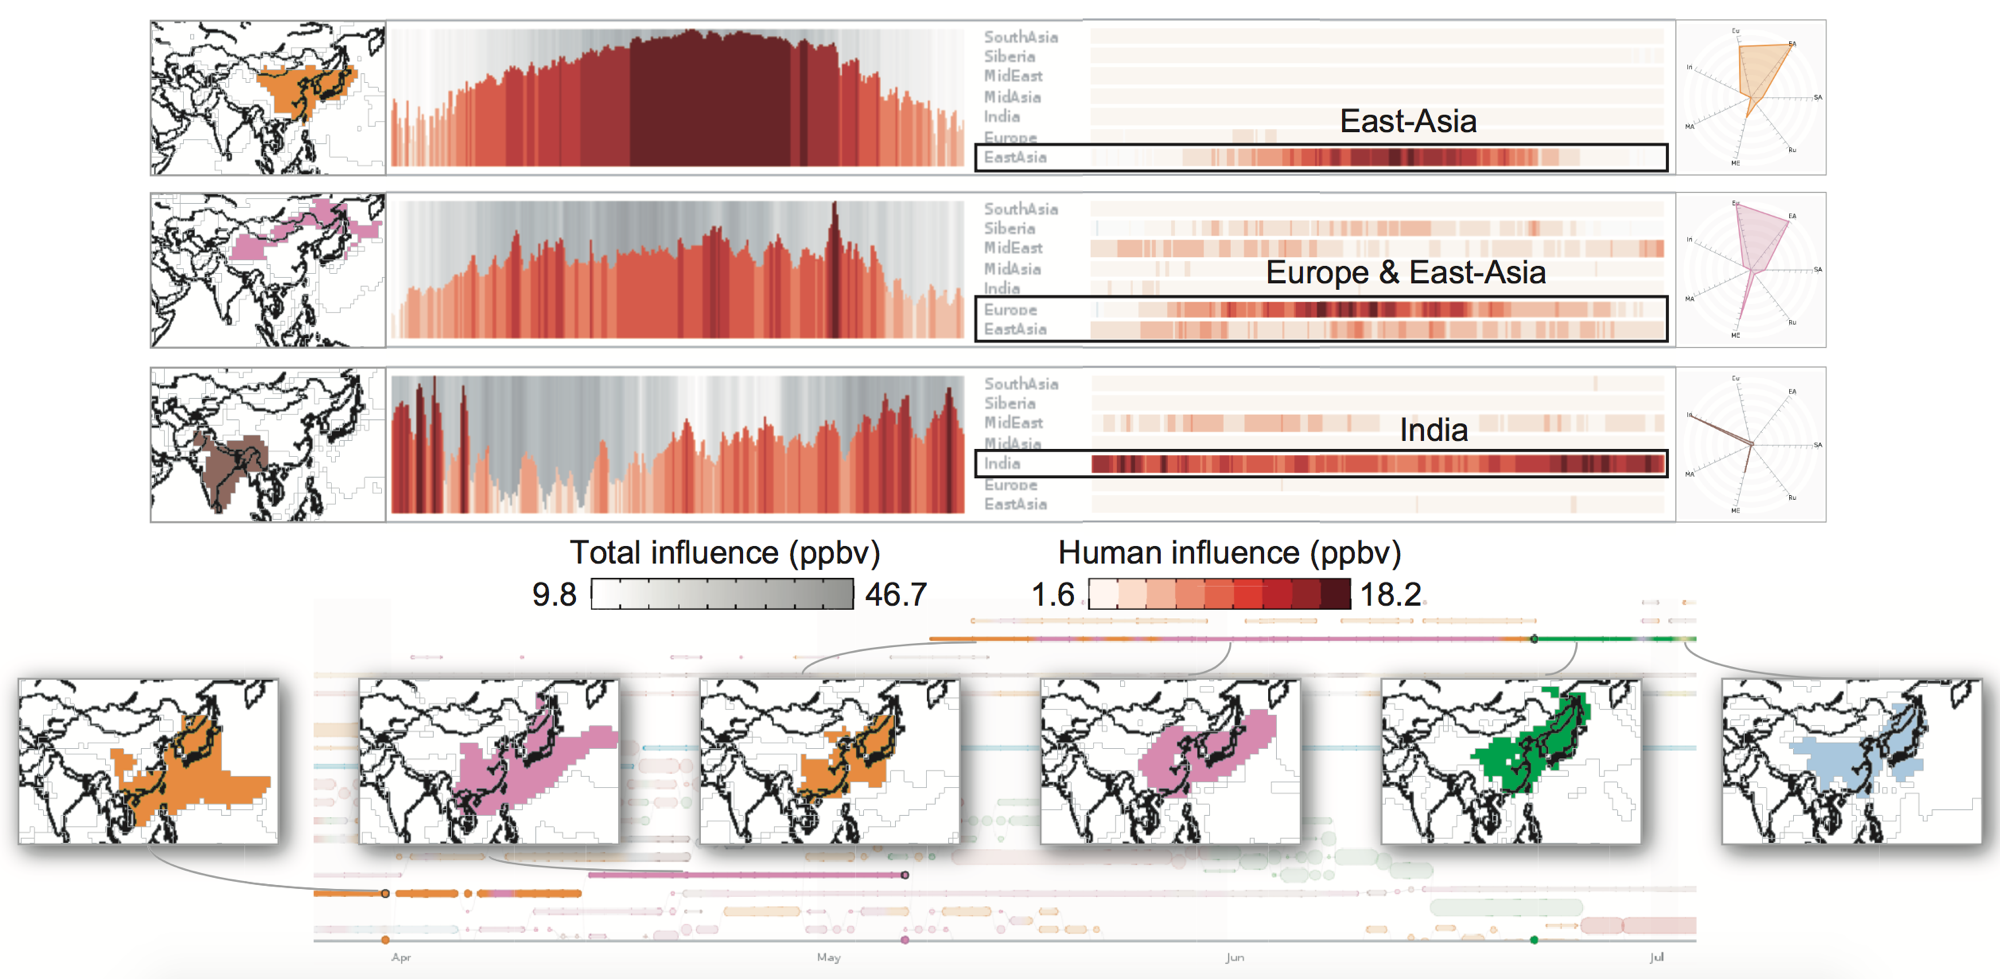
We present a novel visual analysis tool, EnsembleGraph, which aims at helping scientists understand spatiotemporal similarities across runs in time-varying ensemble simulation data. We abstract the input data into a graph, where each node represents a region with similar behaviors across runs and nodes in adjacent time frames are linked if their regions overlap spatially. The visualization of this graph, combined with multiple-linked views showing details, enables users to explore, select, and compare the extracted regions that have similar behaviors. The driving application is the study of regional emission influences over tropospheric ozone, based on the ensemble simulations conducted with different anthropogenic emission absences using MOZART-4. We demonstrate the effectiveness of our method by visualizing the MOZART-4 ensemble simulation data and evaluating the relative regional emission influences on tropospheric ozone concentrations.
- Qingya Shu, Hanqi Guo, Jie Liang, Limei Che, Junfeng Liu, and Xiaoru Yuan
EnsembleGraph: Interactive Visual Analysis of Spatiotemporal Behaviors in Ensemble Simulation Data. In Proceedings of IEEE Pacific Visualization Symposium (PacificVis 2016), pages 56-63, Taipei, Apr. 19-22, 2016.
| DOI | PDF (4.5 MB) | WMV (24.6 MB) | - Can Liu, Yanda Li, Changehe Yang, and Xiaoru Yuan
Event-Based Exploration and Comparison on Time-Varying Ensembles. Journal of Visualization (ChinaVis’19), 23(1): 111-123, 2020.
| DOI | PDF (2.2 MB) |
Ensemble Flow Field Analysis
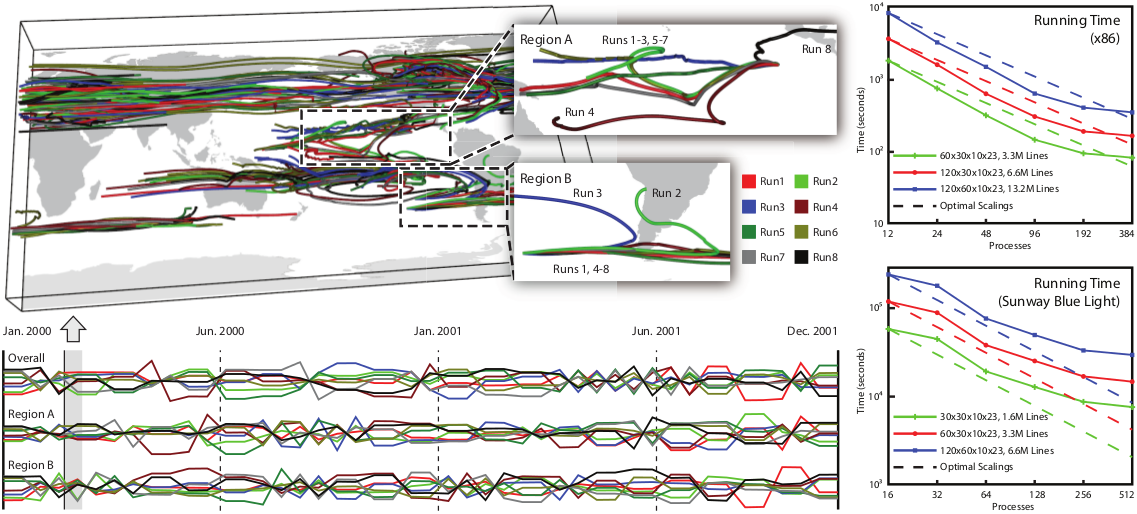
We provide comparative methods for ensemble flow datasets, which are increasingly common in computational science, yet few effective comparative tools have developed for constituents comparison, especially for vector fields. We compute differences between ensemble members are measured with the Lagrangian-based distance metric, instead of fixed locations with the Eulerian specification. For example, the transportation behaviors of wind fields appear totally different in the regions. Although the concept of this idea seems to be straightforward, it requires extraordinary computational power and memory for the pathline computation and comparision. DStep is extended with improved intermediate data management mechanism. The system shows good scalability in the benchmark, which was performed in National Supercomputer Center in Jinan, Shandong, China.
- Hanqi Guo, Xiaoru Yuan, Jian Huang, and Xiaomin Zhu
Coupled Ensemble Flow Line Advection and Analysis. IEEE Transactions on Visualization and Computer Graphics, 19(12):2733-2742, 2013.
| DOI | PDF (3.0MB) | MPEG4 (5.0MB) |
Besides the scalable parallel computation for ensemble data, we have also proposed a longest common subsequence (LCSS)-based approach to compute the distance among vector field ensembles. By measuring how many common blocks the ensemble pathlines pass through, the LCSS distance defines the similarity among vector field ensembles by counting the number of shared domain data blocks. Compared with traditional methods (e.g., pointwise Euclidean distance or dynamic time warping distance), the proposed approach is robust to outliers, missing data, and the sampling rate of the pathline timesteps. Taking advantage of smaller and reusable intermediate output, visualization based on the proposed LCSS approach reveals temporal trends in the data at low storage cost and avoids tracing pathlines repeatedly. We evaluate our method on both synthetic data and simulation data, demonstrating the robustness of the proposed approach.

- Richen Liu, Hanqi Guo, Jiang Zhang, and Xiaoru Yuan
Comparative Visualization of Vector Field Ensembles Based on Longest Common Subsequence. In Proceedings of IEEE Pacific Visualization Symposium (PacificVis 2016), , pages 96-103, Taipei, Apr. 19-22, 2016.
| DOI | PDF (5.5 MB) | Project Page |
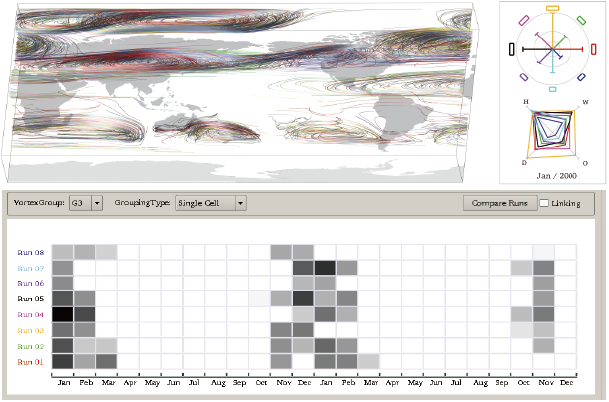
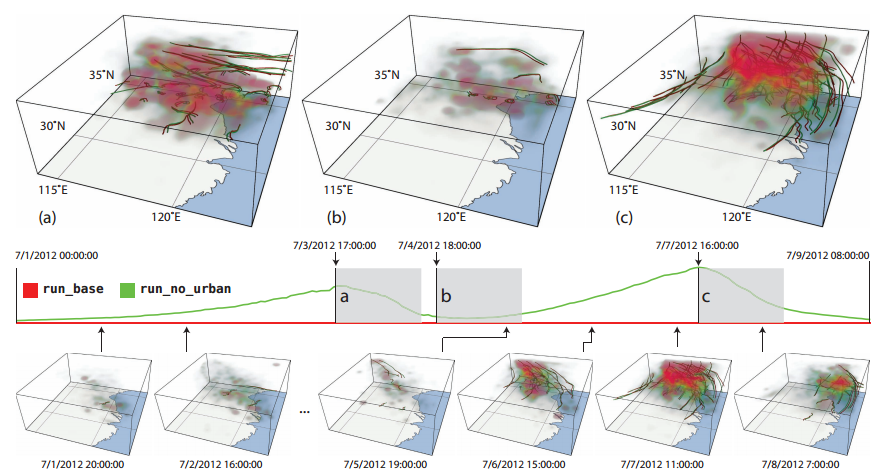
Most of the existing approaches to visualize vector field ensembles are to reveal the uncertainty of individual variables, for example, statistics, variability, etc. However, a user-defined derived feature like vortex or air mass is also quite significant, since they make more sense to domain scientists. Therefore, we further present a new framework to extract user-defined derived features from different simulation runs. Specially, we use a detail-to-overview searching scheme to help extract vortex with a user-defined shape. We further compute the geometry information including the size, the geo-spatial location of the extracted vortexes. We also design some linked views to compare them between different runs. At last, the temporal information such as the occurrence time of the feature is further estimated and compared. Results show that our method is capable of extracting the features across different runs and comparing them spatially and temporally.
- Richen Liu, Hanqi Guo, and Xiaoru Yuan
User-defined feature comparison for vector field ensembles. Journal of Visualization, 20(2):217–229, 2017.
| DOI | PDF (4.9 MB) | - Richen Liu, Hanqi Guo, and Xiaoru Yuan
A Bottom-Up Scheme for User-Defined Feature Comparison in Ensemble Data. ACM SIGGRAPH Asia 2015 Symposium on Visualization in High Performance Computing, Kobe, Japan, November 2-5, 2015.
| DOI | PDF (4.1MB) |
High Performance Flow Visualization
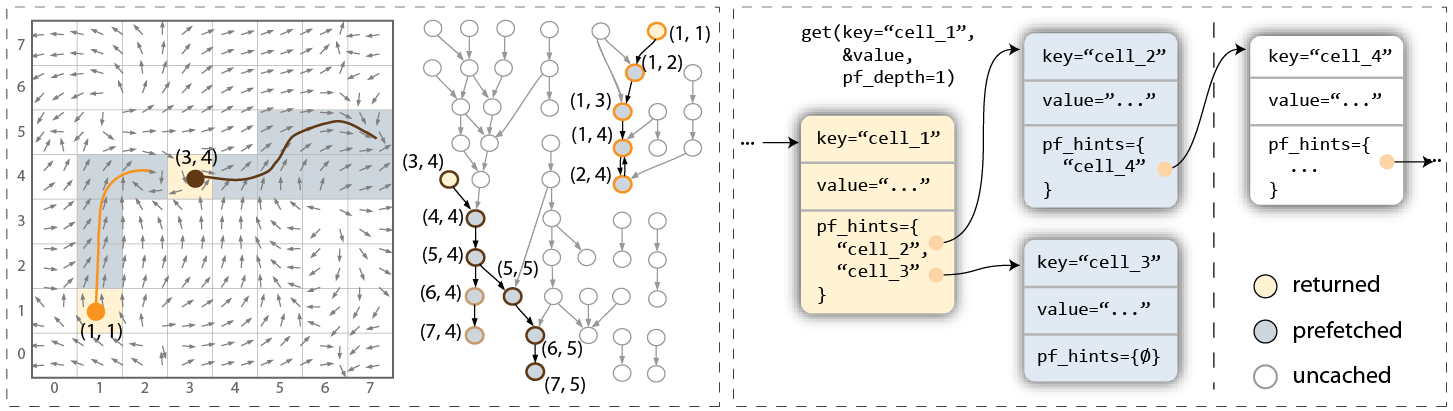
When computing integral curves and integral surfaces for large-scale unsteady flow fields, a major bottleneck is the widening gap between data access demands and the available bandwidth (both I/O and in-memory). In this work, we explore a novel advection-based scheme to manage flow field data for both efficiency and scalability. The key is to first partition flow field into blocklets (e.g. cells or very fine-grained blocks of cells), and then (pre)fetch and manage blocklets on-demand using a parallel key-value store. The benefits are (1) greatly increasing the scale of local-range analysis (e.g. source-destination queries, streak surface generation) that can fit within any given limit of hardware resources; (2) improving memory and I/O bandwidth-efficiencies as well as the scalability of naive task-parallel particle advection. We demonstrate our method using a prototype system that works on workstation and also in supercomputing environments. Results show significantly reduced I/O overhead compared to accessing raw flow data, and also high scalability on a supercomputer for a variety of applications.
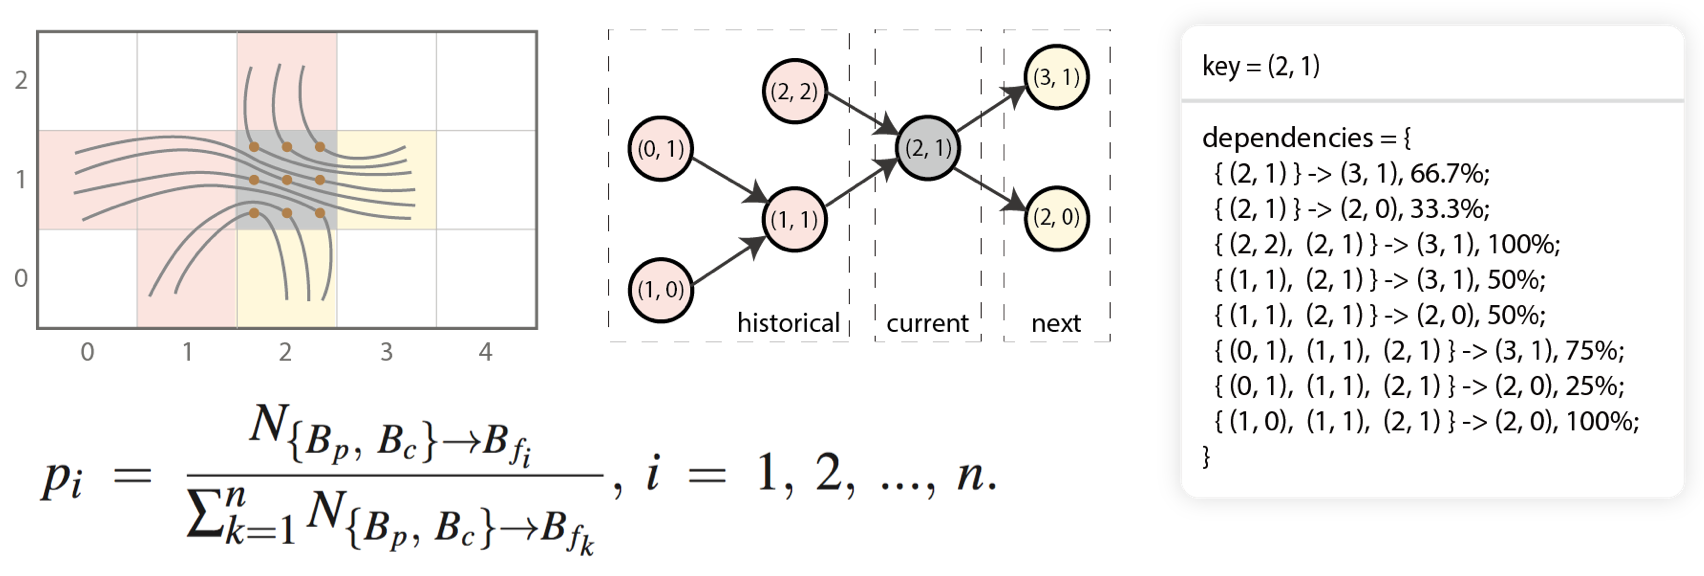
Furthermore, based on the observation that more sophisticated access patterns exist in particle tracing, we present a novel high-order access dependencies-based model for efficient pathline computation in unsteady flow visualization. By taking longer access sequences into account to model more sophisticated data access patterns in particle tracing, our method greatly improves the accuracy and reliability in data access prediction. In our work, high-order access dependencies are calculated by tracing uniformly seeded pathlines in both forward and backward directions in a preprocessing stage. The effectiveness of our approach is demonstrated through a parallel particle tracing framework with high-order data prefetching. Results show that our method achieves higher data locality and hence improves the efficiency of pathline computation.
- Hanqi Guo, Jiang Zhang, Richen Liu, Lu Liu, Xiaoru Yuan, Jian Huang, Xiangfei Meng, and Jingshan Pan.
Advection-based Sparse Data Management for Visualizing Unsteady Flow. IEEE Transactions on Visualization and Computer Graphics (SciVis'14), 20(12):2555-2564, 2014.
| DOI | PDF (4.8 MB) | - Jiang Zhang, Hanqi Guo, and Xiaoru Yuan.
Efficient Unsteady Flow Visualization with High-Order Access Dependencies. In Proceedings of IEEE Pacific Visualization Symposium (PacificVis 2016), pages 80-87, Taipei, Apr. 19-22, 2016.
| DOI | PDF (2.5 MB) | - Fan Hong, Chongke Bi, Hanqi Guo, Kenji Ono, and Xiaoru Yuan.
Access Pattern Learning with Long Short-Term Memory for Parallel Particle Tracing In Proceedings of IEEE Pacific Visualization Symposium (PacificVis 2018), pages 76-85, Kobe, Japan, Apr. 10-13, 2018.
| DOI | PDF (0.5 MB) |
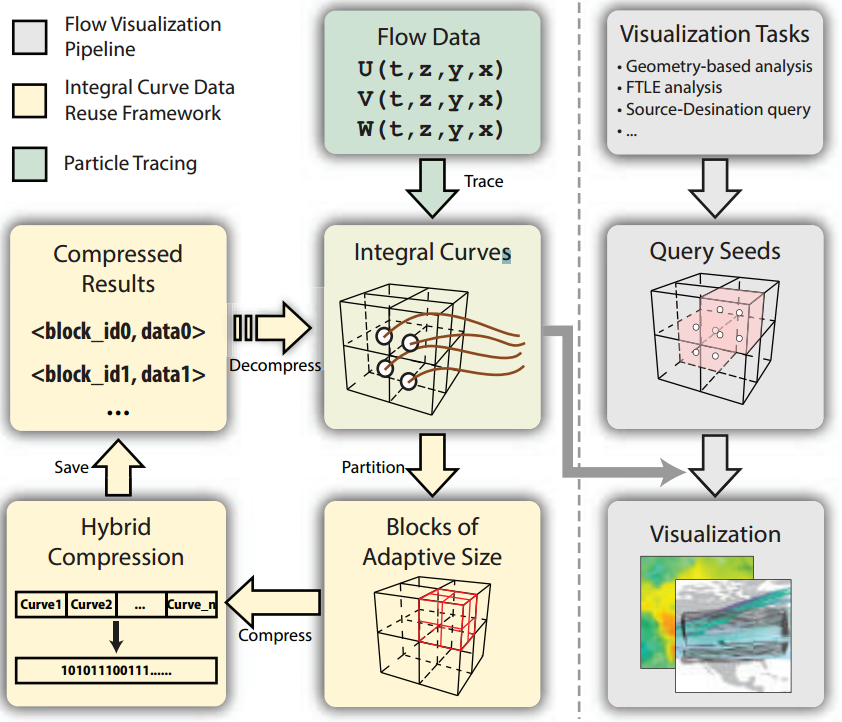
Currently, by default, integral curves are repeatedly re-computed in different flow visualization applications, such as FTLE field computation, sourcedestination queries, etc., leading to unnecessary resource cost. We present a compression-based data reuse framework for integral curves, in order to greatly reduce their retrieval cost, especially in a resource-limited environment. In our design, a hierarchical and hybrid compression scheme is proposed to balance three objectives, including high compression ratio, controllable error, and low decompression cost. Results have shown that our data reuse framework could acquire tens of times acceleration in the resource-limited environment compared to on-the-fly particle tracing, and keep controllable information loss. Moreover, our method could provide fast integral curve retrieval for more complex data, such as unstructured mesh data.
- Fan Hong, Chongke Bi, Hanqi Guo, Kenji Ono, and Xiaoru Yuan.
Compression-based Integral Curve Data Reuse Framework for Flow Visualization Journal of Visualization, 2017.
| DOI | PDF (0.5 MB) |
- Jiang Zhang, Hanqi Guo, Xiaoru Yuan, and Tom Peterka.
Dynamic Data Repartitioning for Load-Balanced Parallel Particle Tracing In Proceedings of IEEE Pacific Visualization Symposium (PacificVis 2018), pages 86-95, Kobe, Japan, Apr. 10-13, 2018.
| DOI | PDF (4.1 MB) | - Jiang Zhang, Hanqi Guo, Fan Hong, Xiaoru Yuan, and Tom Peterka.
Dynamic Load Balancing Based on Constrained K-D Tree Decomposition for Parallel Particle Tracing IEEE Transactions on Visualization and Computer Graphics (SciVis’17), 24(1):954-963, 2018.
| DOI | PDF (2.2 MB) |
WYSIWYG VolViz
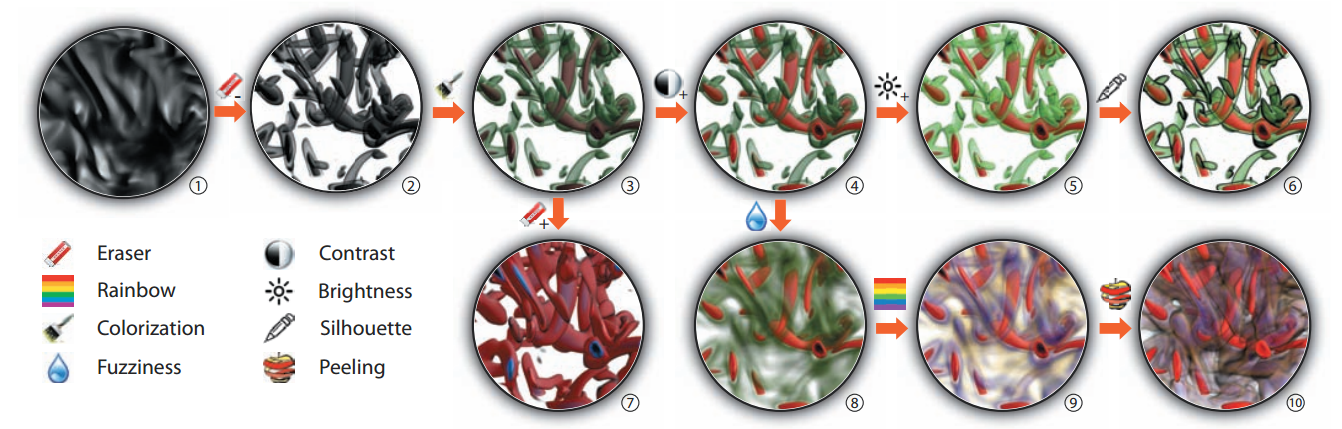
In addition to the data analysis methods with scalability, we also introduce novel user interaction for the visualization of flow data. In WYSIWYG VolViz, sketch-based user interface is provided for flexible exploration of scalar fields, without editing visualization parameters, e.g. transfer functions.
- Hanqi Guo, Ningyu Mao, and Xiaoru Yuan
WYSIWYG (What You See is What You Get) Volume Visualization. IEEE Transactions on Visualization and Computer Graphics, 17(12):2106-2114, 2011.
| DOI | PDF (1.4 MB) | MPEG4 (6.2 MB) | - Hanqi Guo, and Xiaoru Yuan
Local WYSIWYG Volume Visualization. In Proceedings of IEEE Pacific Visualization Symposium (PacificVis 2013), pages 65-72, Sydney, NSW, Australia, Feb. 28-Mar.1, 2013.
| DOI | PDF (643 KB) | MPEG4 (8.2MB) |
Parallel and Distributed Visualization System Design
Scientific visualization, which is an interdisciplinary field of research and application, aims at helping domain scientists analyze and understand the data. Visualization systems play the central role in the delivery process. However, there are several problems in the current production visualization systems, including the intuitiveness of the user interface, complexity of the parameter configuration, and the difficulty of developing new visualization methods. In this work, we design and implement a new visualization system. It not only supports the common data types and formats, but also includes several cutting-edge research works. The distributed software architecture also makes it flexible to create extensions. The system can be widely applied in various domains, including climate and environment sciences, geology, biology and medical sciences.
- Hanqi Guo, and Xiaoru Yuan
Design and Application of PKU Scientific Visualization System. In Proceedings of National Annual Conference on High Performance Computing (HPC China 2013), pages 551-558, Guilin, China, Oct. 27-Oct. 31, 2013. (in Chinese), 2013.
| PDF (1.3 MB) |
Applications
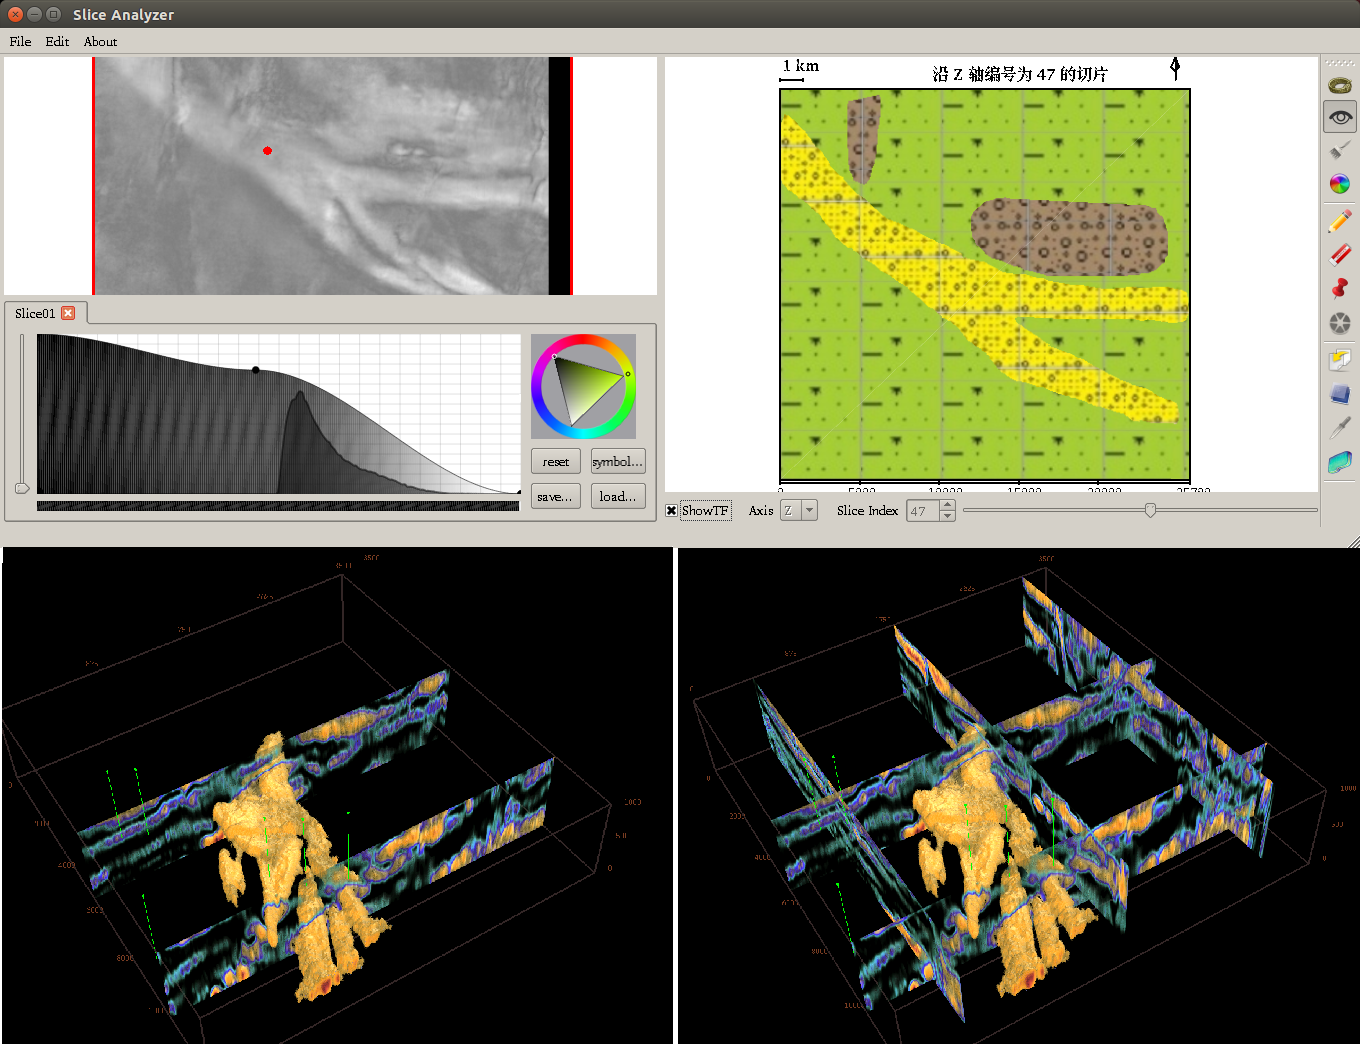
Seismic visualization plays an indispensable role in exploring oil and gas. The seismic volume data are collected by sending sound waves into the earth, recording and processing the reflection echoes. The seismic volume exploration is challenging due to its natural properties, composition-intensive, discontinuous and noisy. We propose an interactive approach to visualize the 3D structural geological-composition by a 2D slice analyzer guided by multi-scale transfer function sensitivity.
- Richen Liu, Hanqi Guo, and Xiaoru Yuan
Seismic Structure Extraction Based on Multi-scale Sensitivity Analysis. Journal of Visualization, 17(3):157-166, 2014. Springer.
| DOI | PDF (2.3 MB) | Project Page |
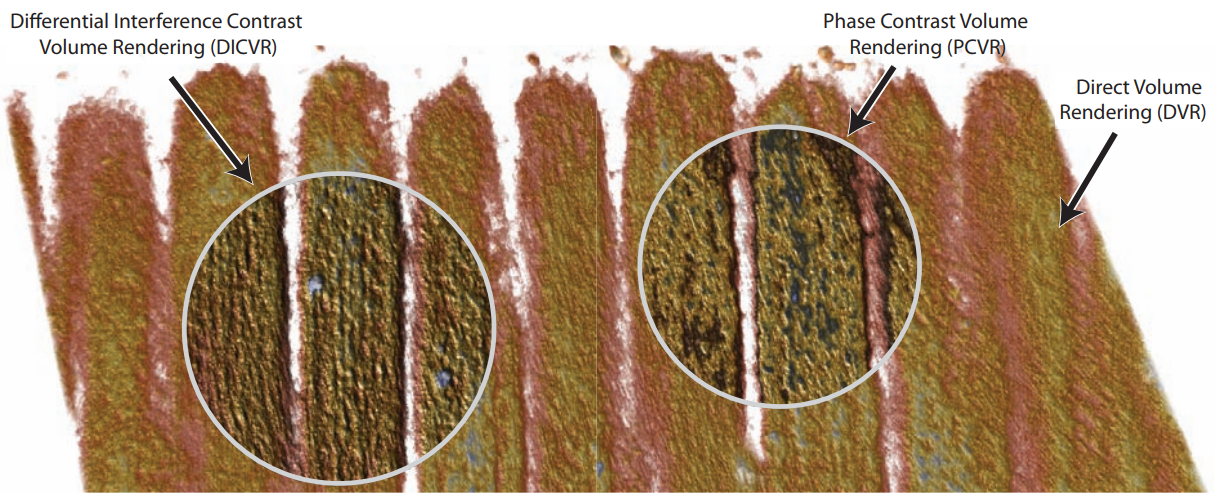
We proposed a novel volume illustration technique inspired by interference microscopy, which has been successfully used in biological, medical and material science over decades. The optical phenomenon in interference microscopy that accounts light interference over transparent specimens is simulated, in order to generate contrast enhanced and illustrative volume visualization results.
- Hanqi Guo, Xiaoru Yuan, Jie Liu, Guihua Shan, Xuebin Chi, and Fei Sun
Interference Microscopy Volume Illustration for Biomedical Data. In Proceedings of IEEE Pacific Visualization Symposium (PacificVis 2012), pages 177-184, Songdo, Korea, Feb. 28-Mar. 2, 2012.
| DOI | PDF (0.97MB) | MPEG4 (3.9MB) |
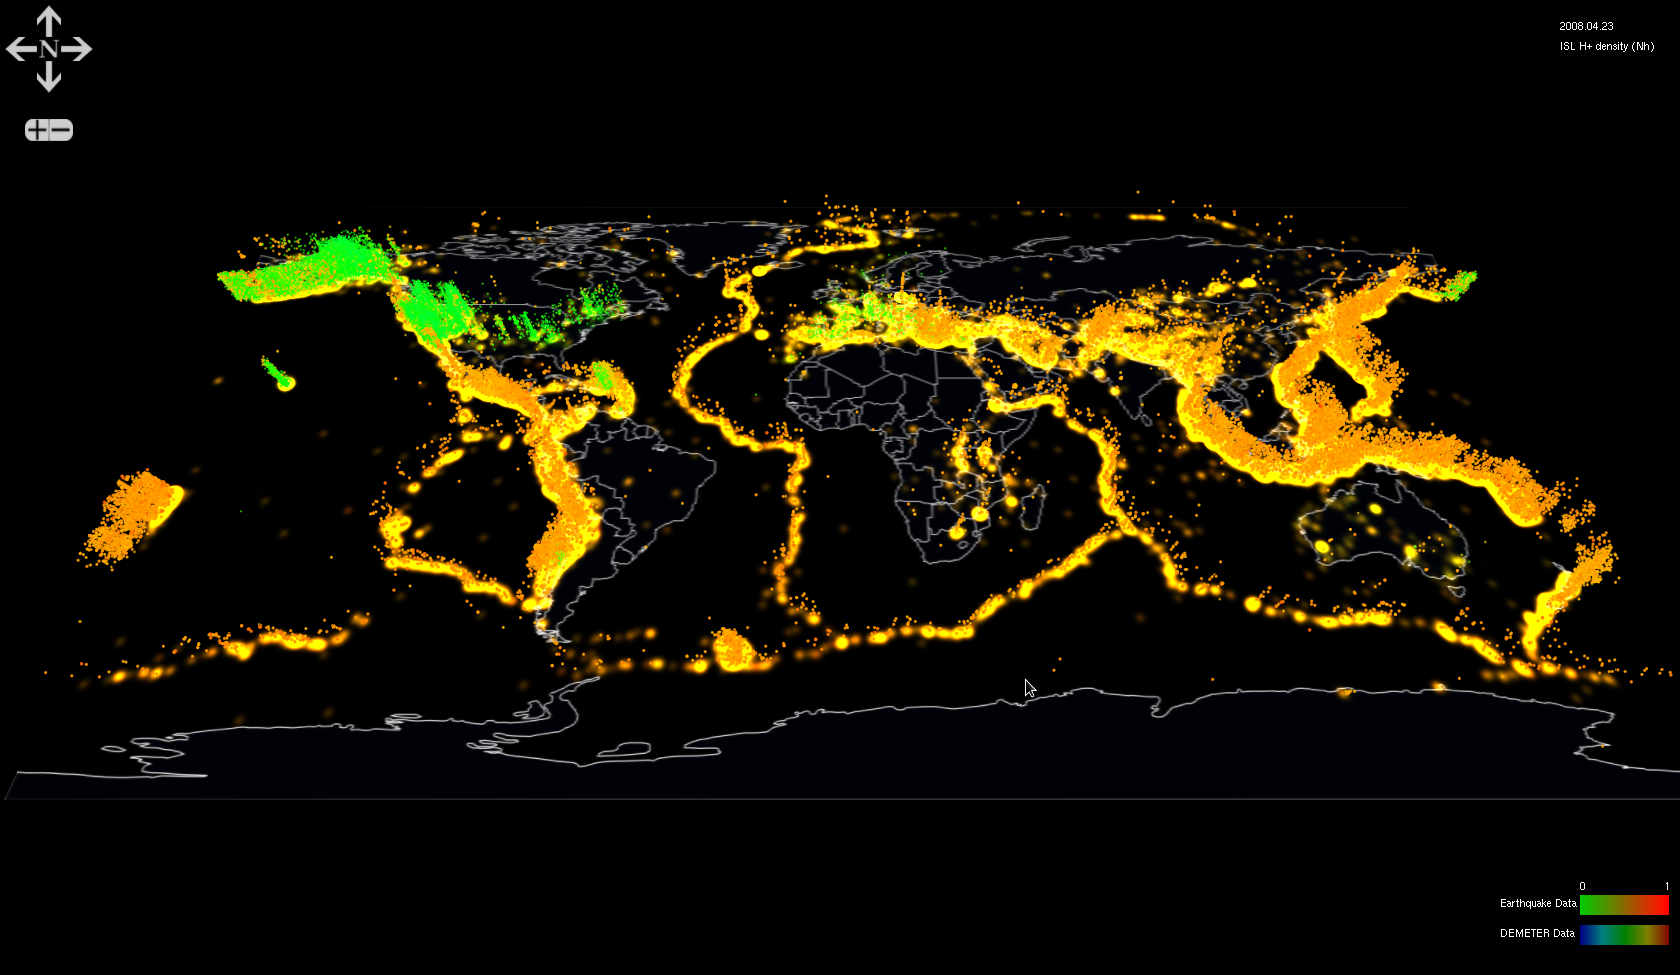
In seismic research, a working hypothesis is that ionospheric disturbances is related to lithosphere activities such as earthquakes. Domain scientists are working to find patterns from certain ionospheric attributes related to seismic activities. However, to find patterns from large amount of data is challenging, since it is hard to extract, formulate and search patterns. To address on these challenges, we developed an interactive system which supports the workflow of seismic research on ionospheric data. Our system can assist domain scientists to propose and examine hypotheses on relationships between ionospheric disturbance and seismic activities.
- Fan Hong, Siming Chen, Hanqi Guo, Xiaoru Yuan, Jian Huang, and Yongxian Zhang
Visual Analysis of Ionospheric Disturbance Hypotheses about Earthquake. IEEE Scientific Visualization 2013 (SciVis Poster), Atlanta, GA, USA, October 13-18, 2013.
| PDF (11MB) | - Fan Hong, Siming Chen, Hanqi Guo, Xiaoru Yuan, Jian Huang, Yongxian Zhang
Visual Exploration of Ionosphere Disturbances for Earthquake Research. In Proceedings of SIGGRAPH Aisa '17 Symposium of Visualization, Bangkok, Thailand, Nov. 27-30, 2017. (Honorable Mention Award)
| PDF (1.9MB) |
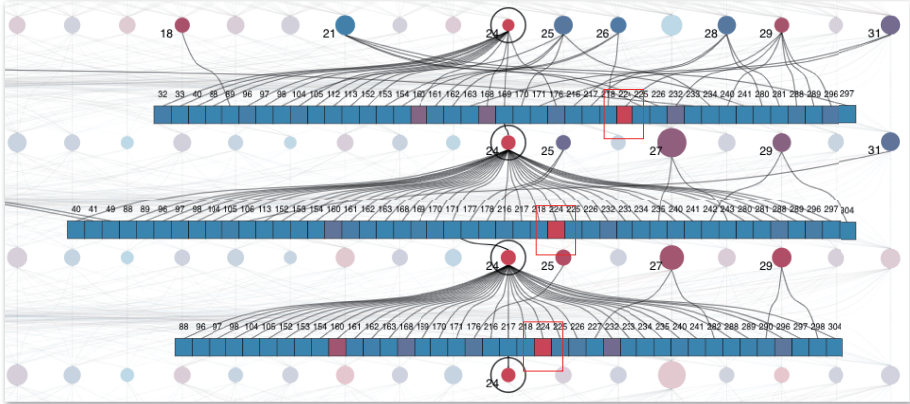
In exploring and diagnosing the dynamic load balance (data and task partition) process of parallel particle tracing in flow visualization, we propose an interactive visual analytical approach. To understand the complex nature of the parallel processes, it is necessary to integrate the information of the behaviors and patterns of the computing processes, data changes and movements, task status and exchanges, and gain the insight of the relationships among them.
- Jiang Zhang, Changhe Yang, Yanda Li, Li Chen and Xiaoru Yuan
LBVis: Interactive Dynamic Load Balancing Visualization in Parallel Particle Tracing. In Proceedings of IEEE Pacific Visualization Symposium (PacificVis'20, Notes, Honorable Mention Award), pages 91-95, Tianjin, China, June 3-5, 2020.
| PDF (9.7MB) |